Diagnose Control Error
Diagnose Control Error in AWS CloudWatch Log Groups
In this guide, you will:
- Use Guardrails console and AWS CloudWatch to Diagnose the control error.
When diagnosing error messages in the Guardrails console, control logs typically provide sufficient information to identify the root cause. However, in some cases, additional details may be needed for a more thorough diagnosis, which can be retrieved from the AWS CloudWatch log groups.
Prerequisites
- Turbot/Operator permissions at the Turbot resource level and access to the Guardrails AWS account.
- Familiarity with Guardrails console and AWS CloudWatch service.
Step 1: Login to Guardrails Console
Log into the Guardrails console.
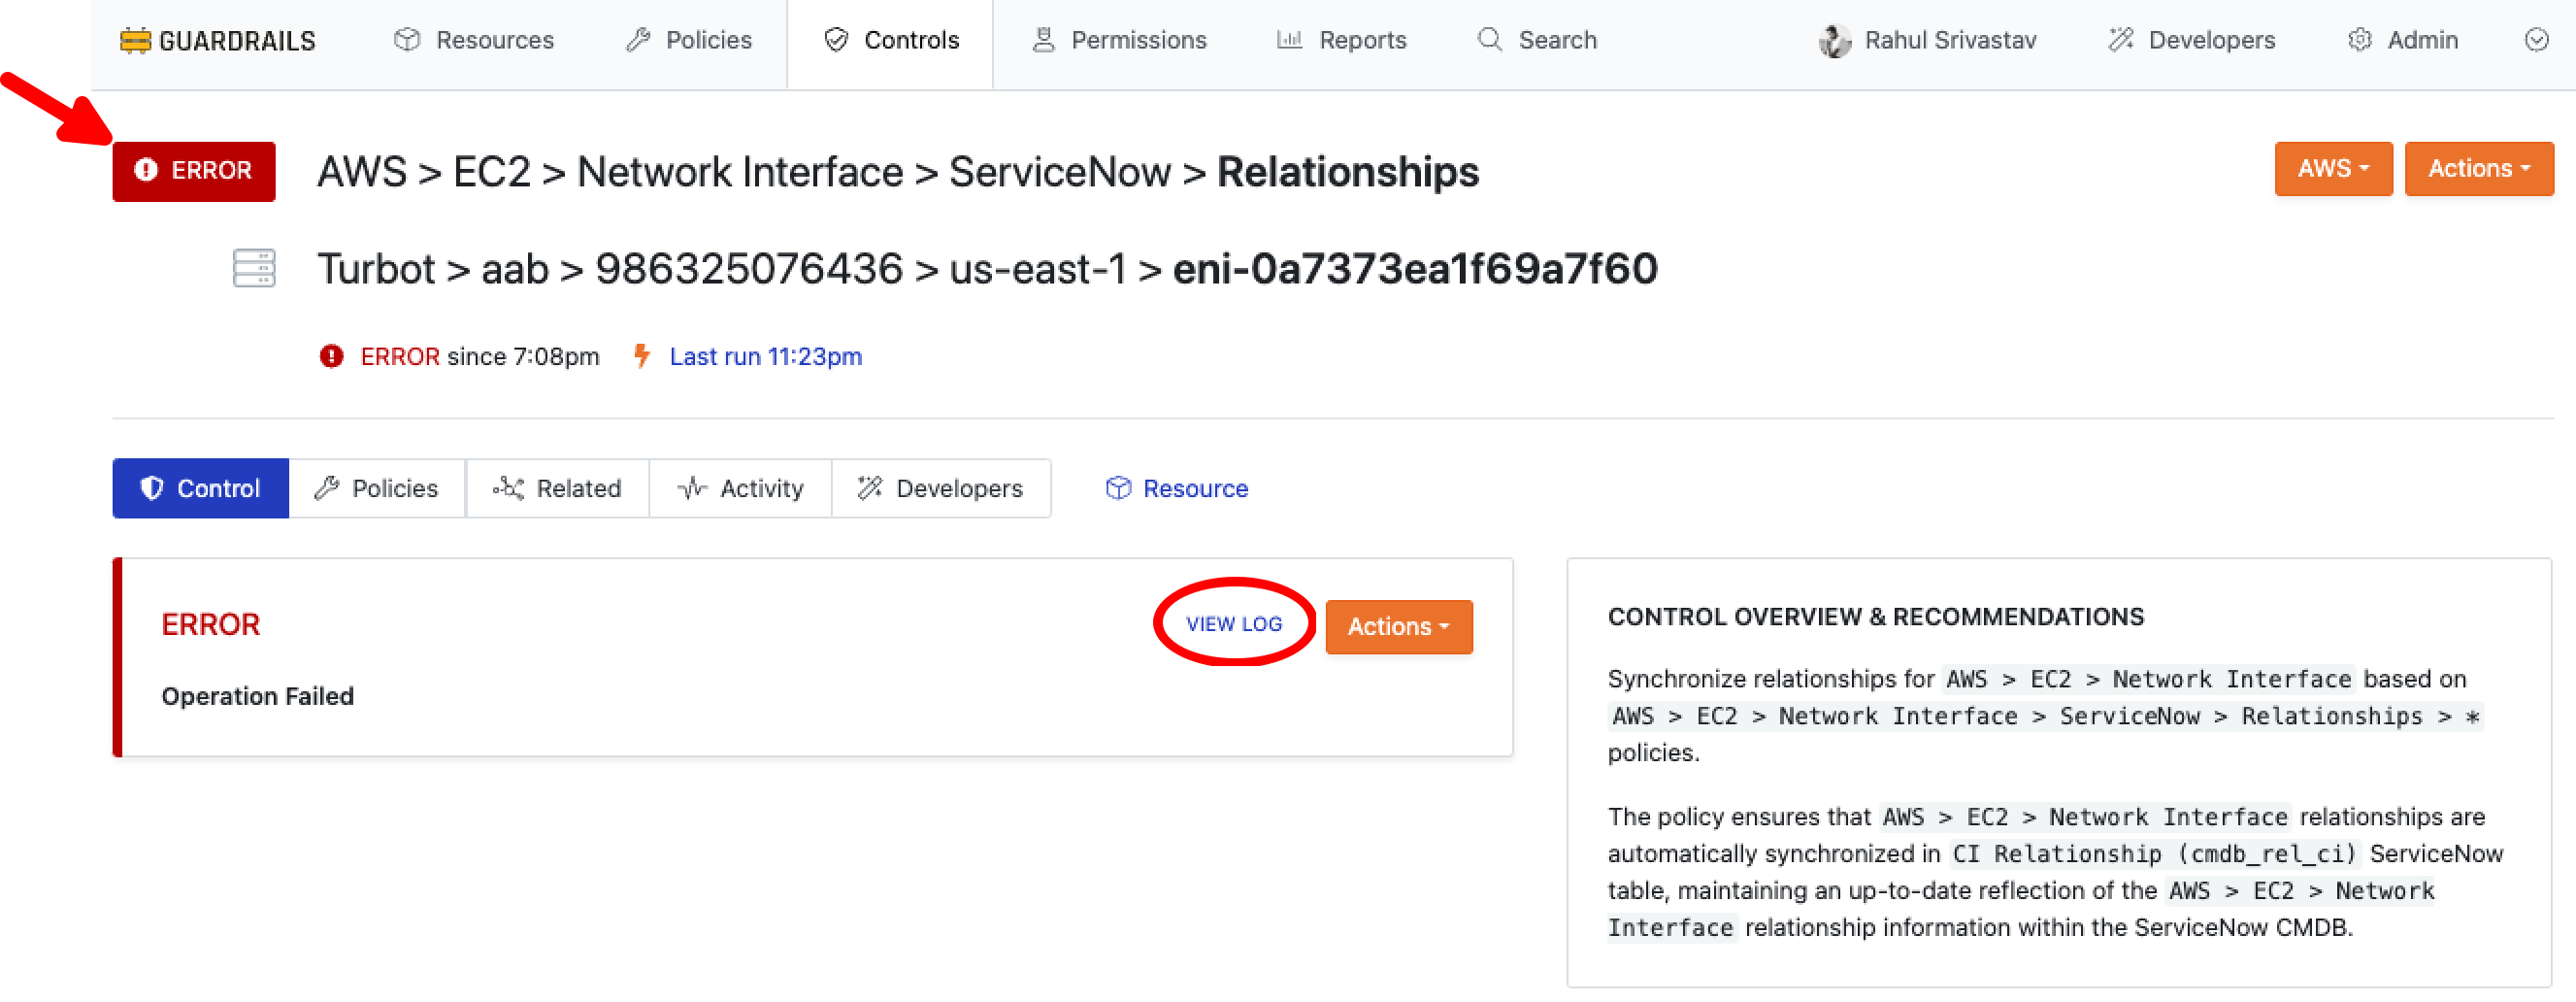
Step 2: Navigate To Control Error
Navigate to the control in an error state to be investigated. Select VIEW LOG.
Step 3: View Logs
Select Debug and above from the Level filter.

Select the Internal Error message to expand it.
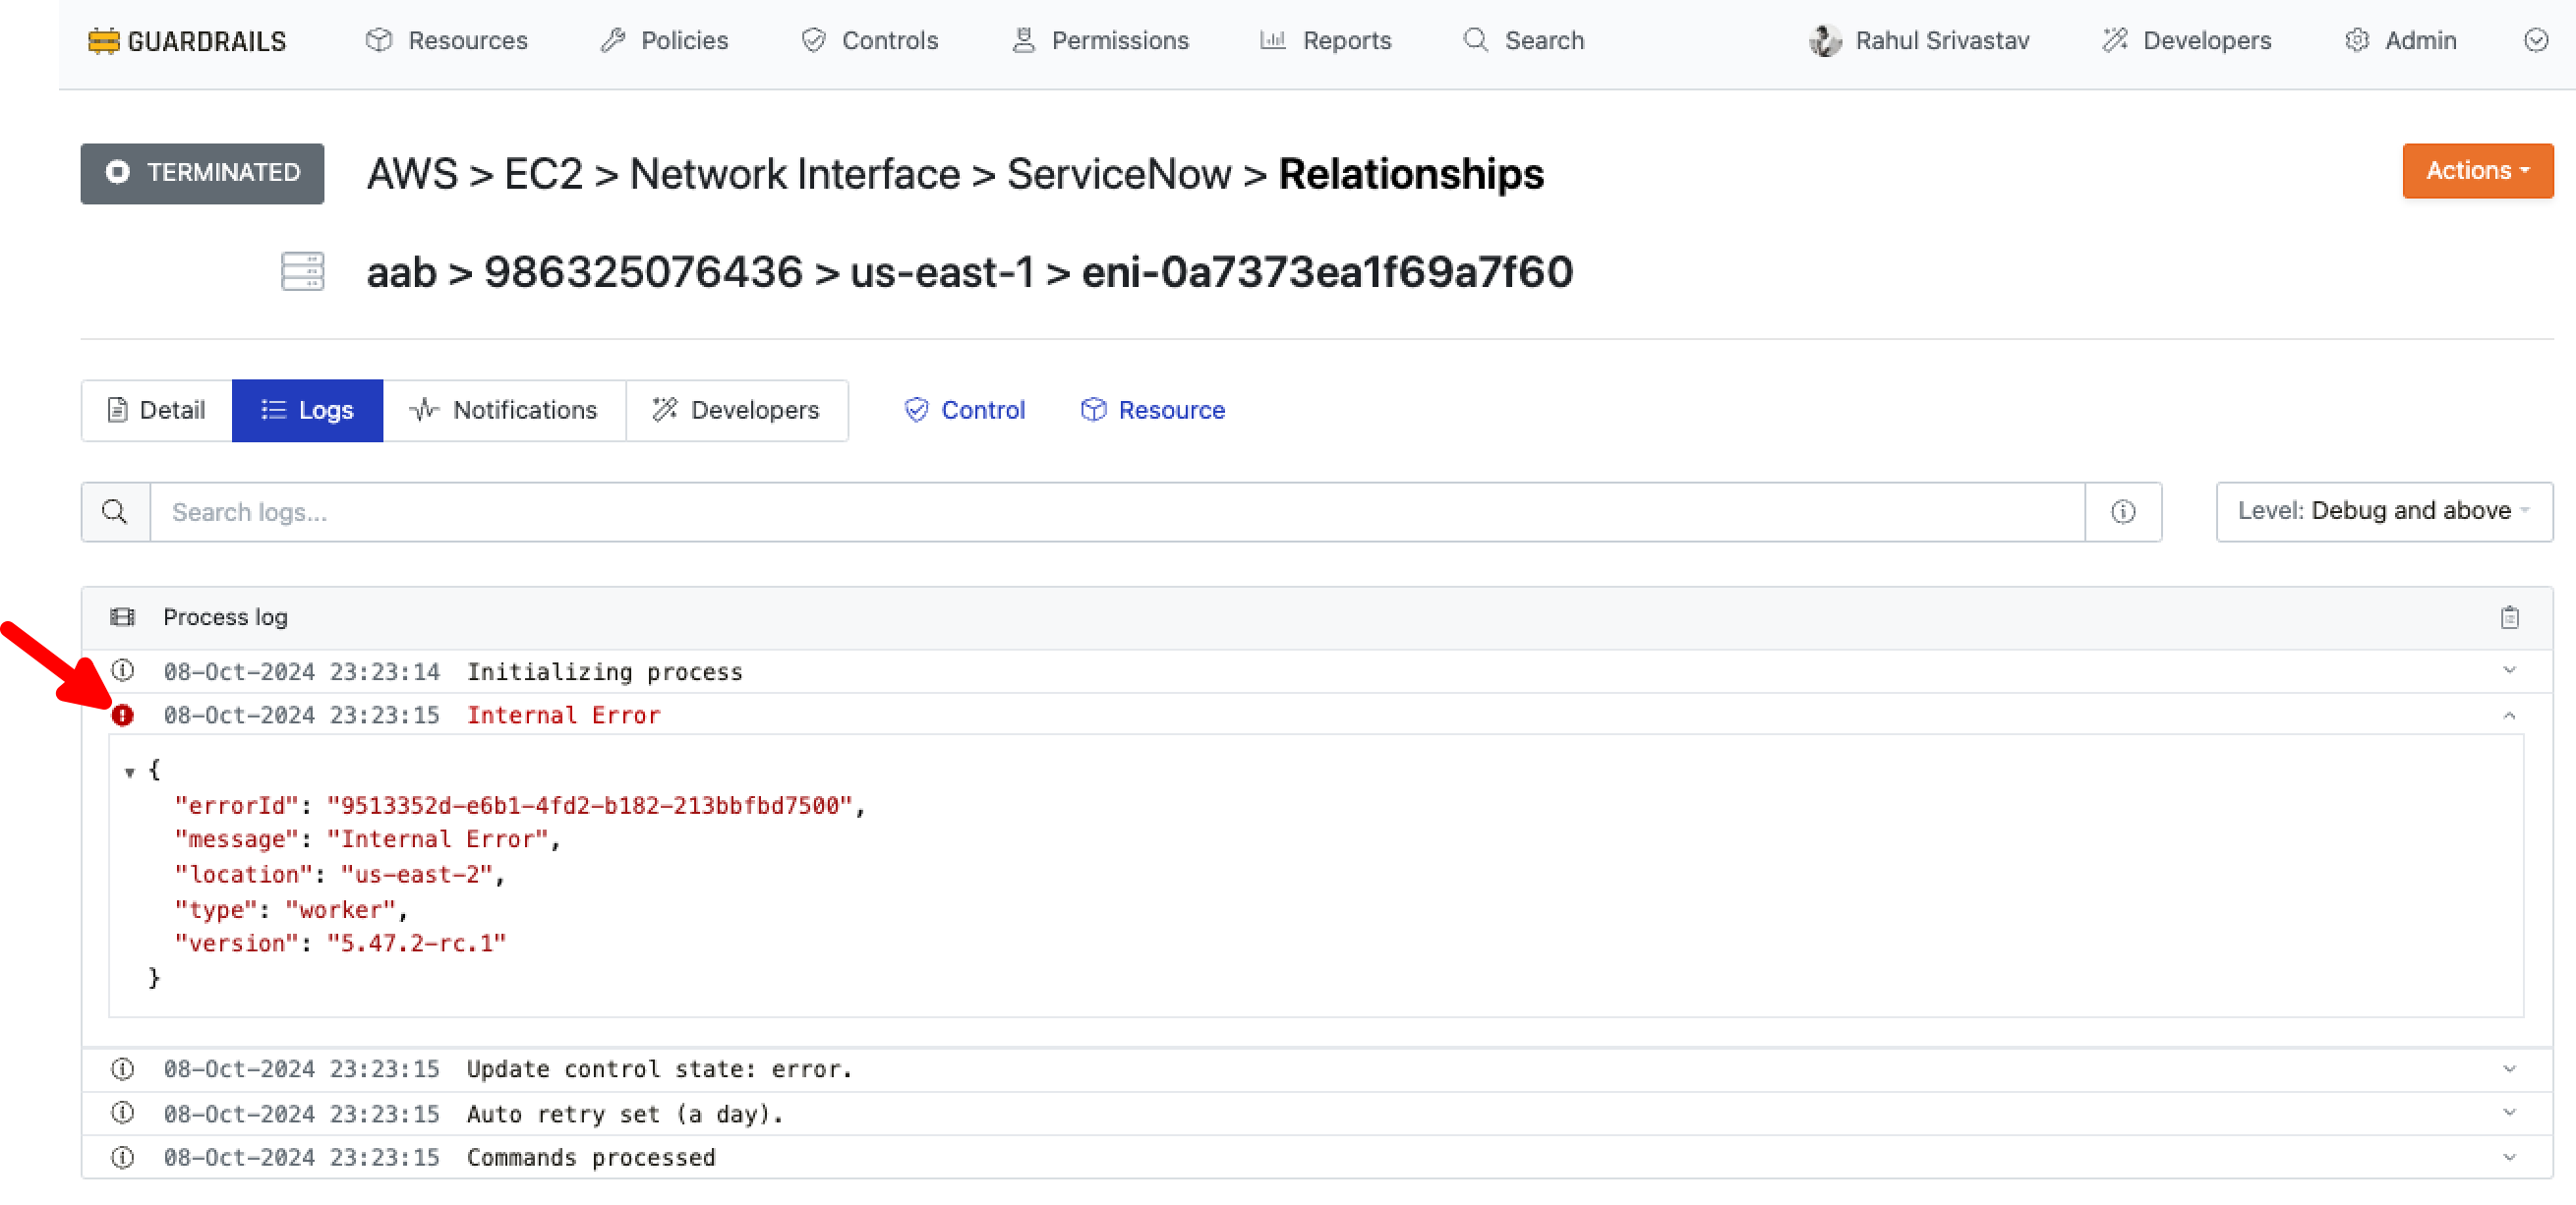
Upon expanding the error, there isn't enough detailed information to determine the root cause, requiring further investigation in the AWS CloudWatch log groups.
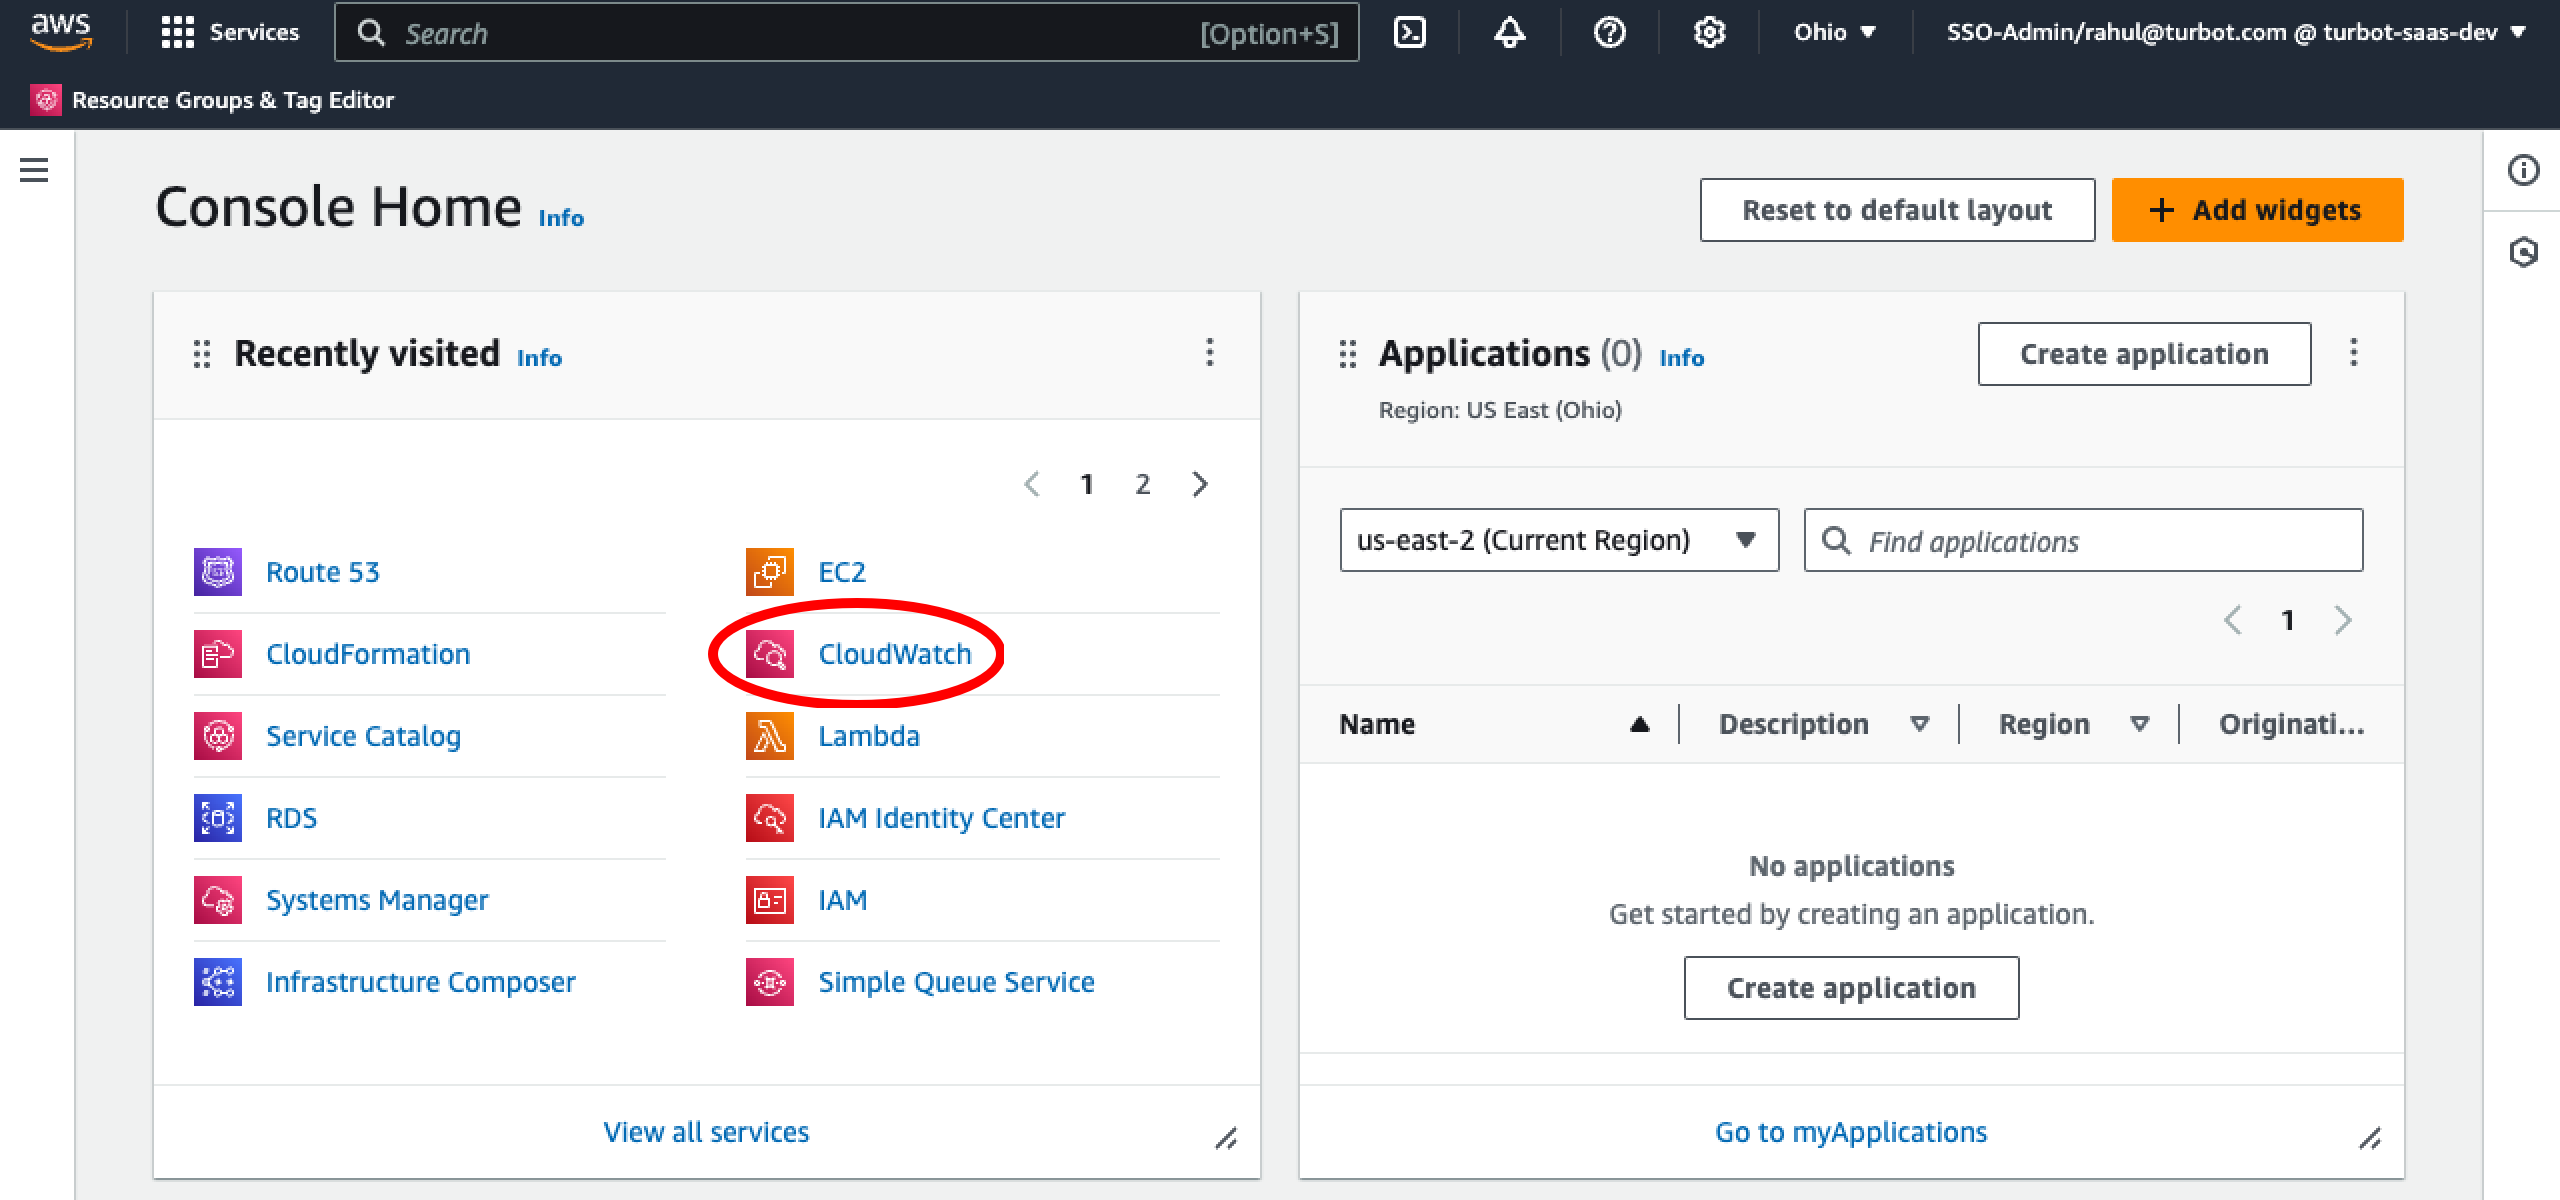
Step 4: Access AWS Console
Open the AWS Console and navigate to the CloudWatch service in the region where Guardrails is deployed.
Step 5: Navigate to Log Groups
Choose Log Groups from the left navigation menu.
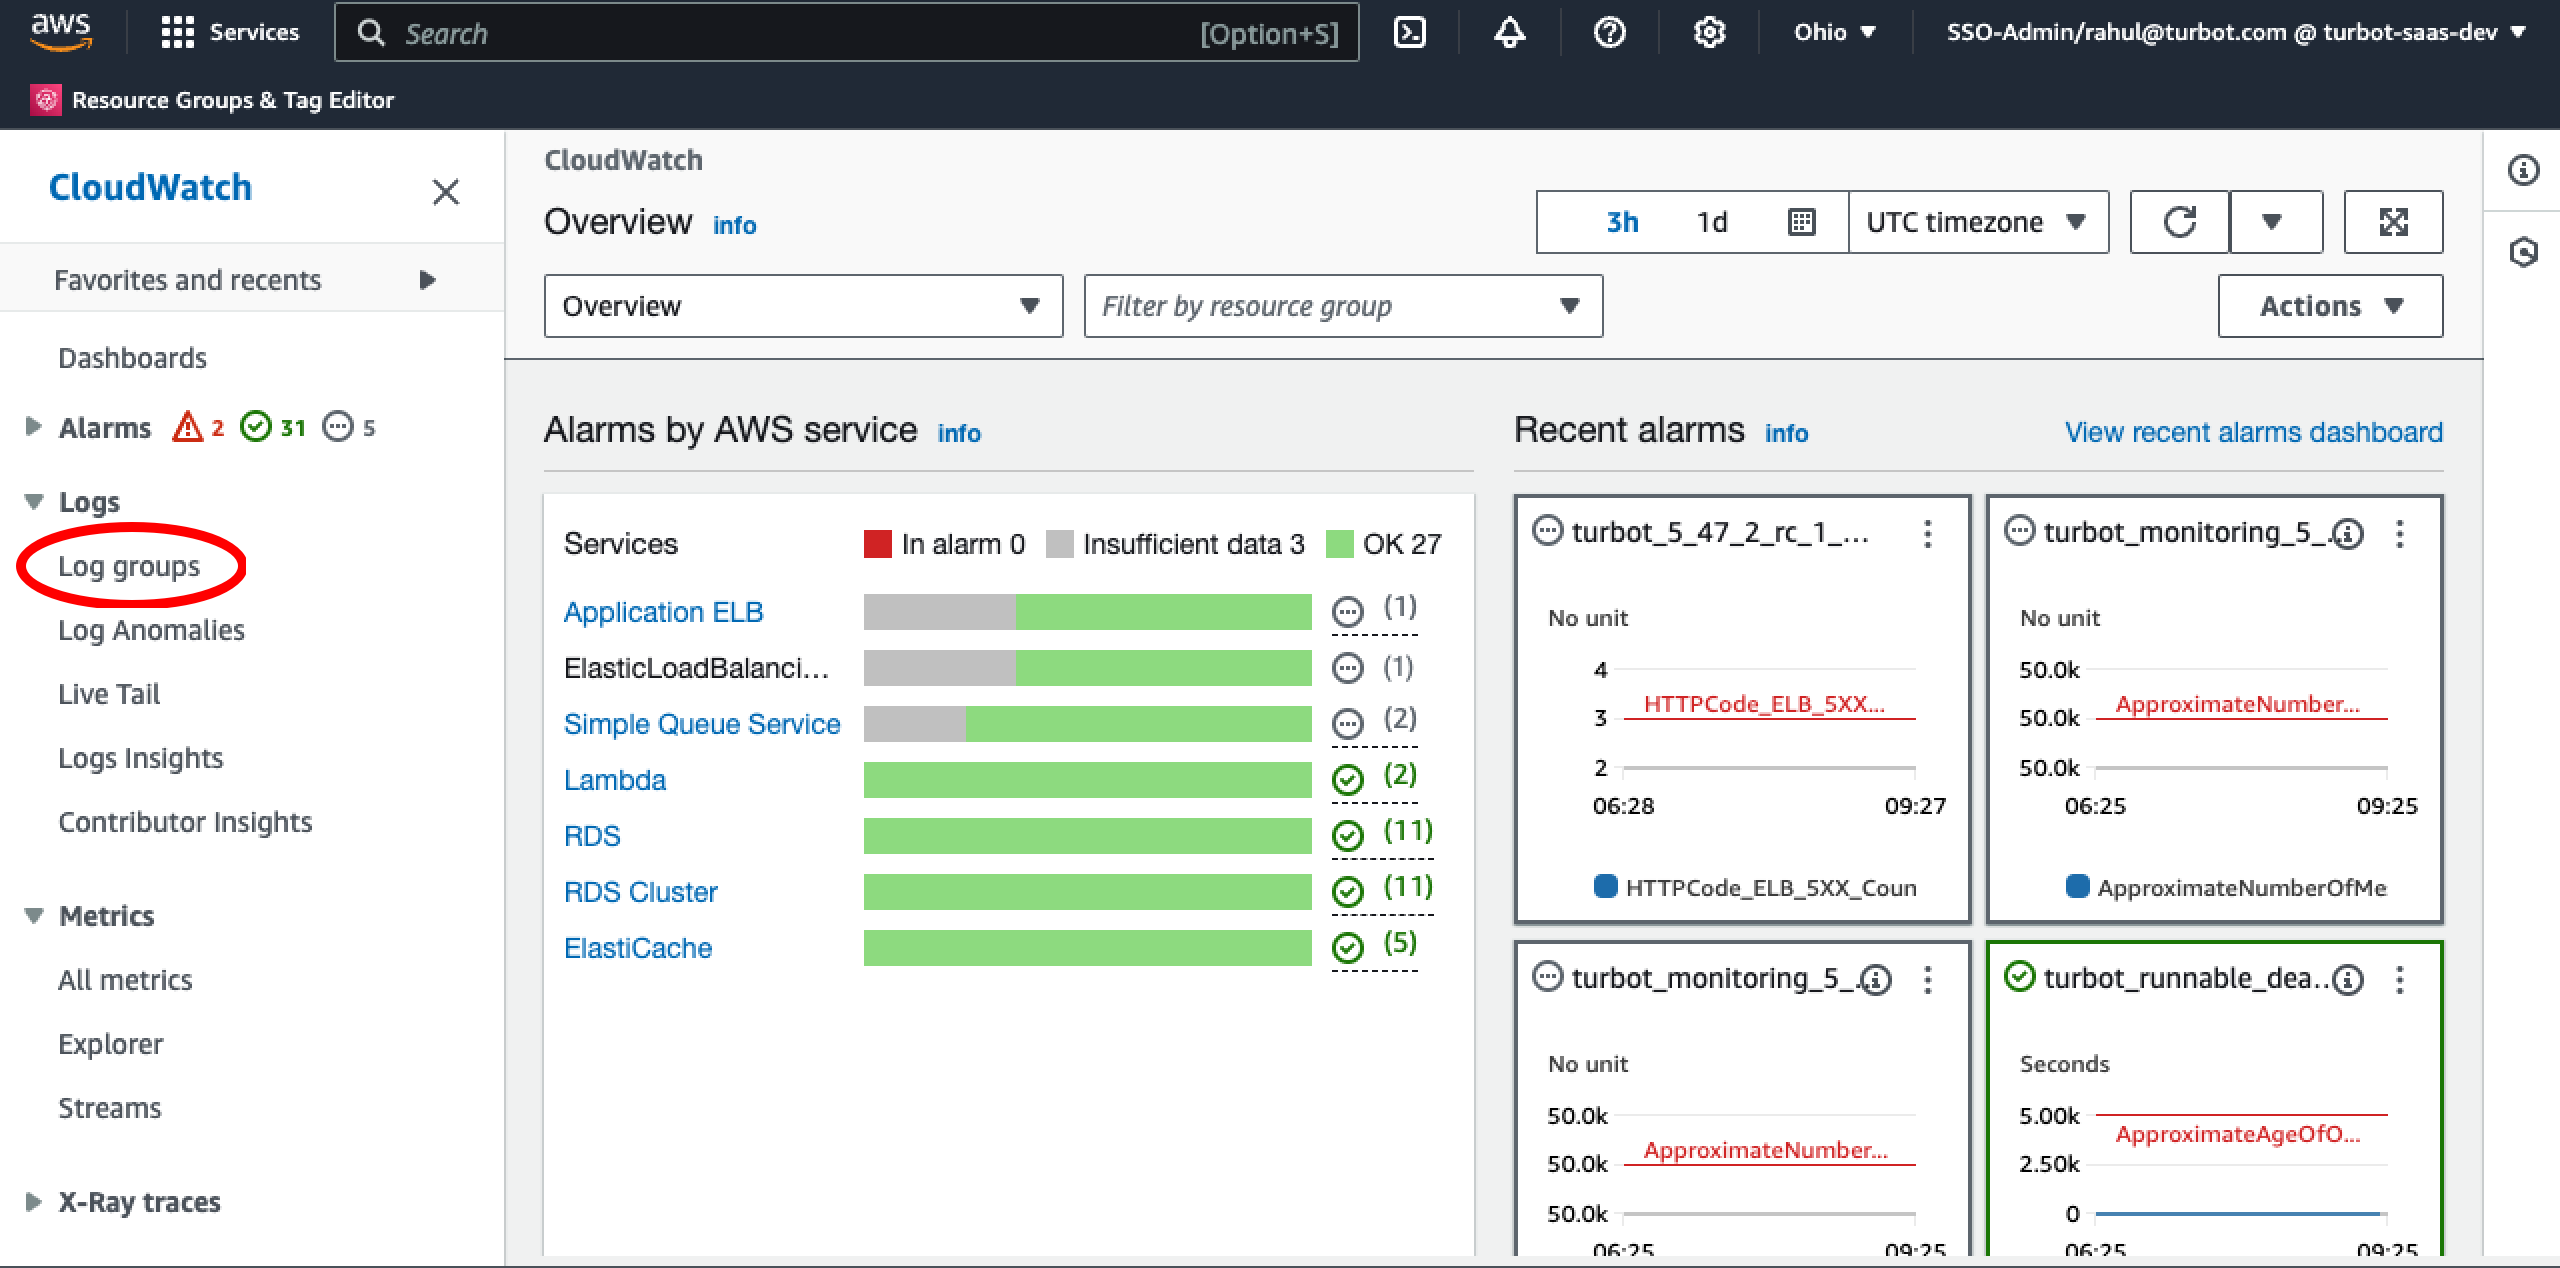
Step 6: Search Log Group
Search for log groups with a key word based on the workspace version received from Step 3, this will render list of matching Log group names with the prefix /aws/lambda/turbot_ followed by the workspace version
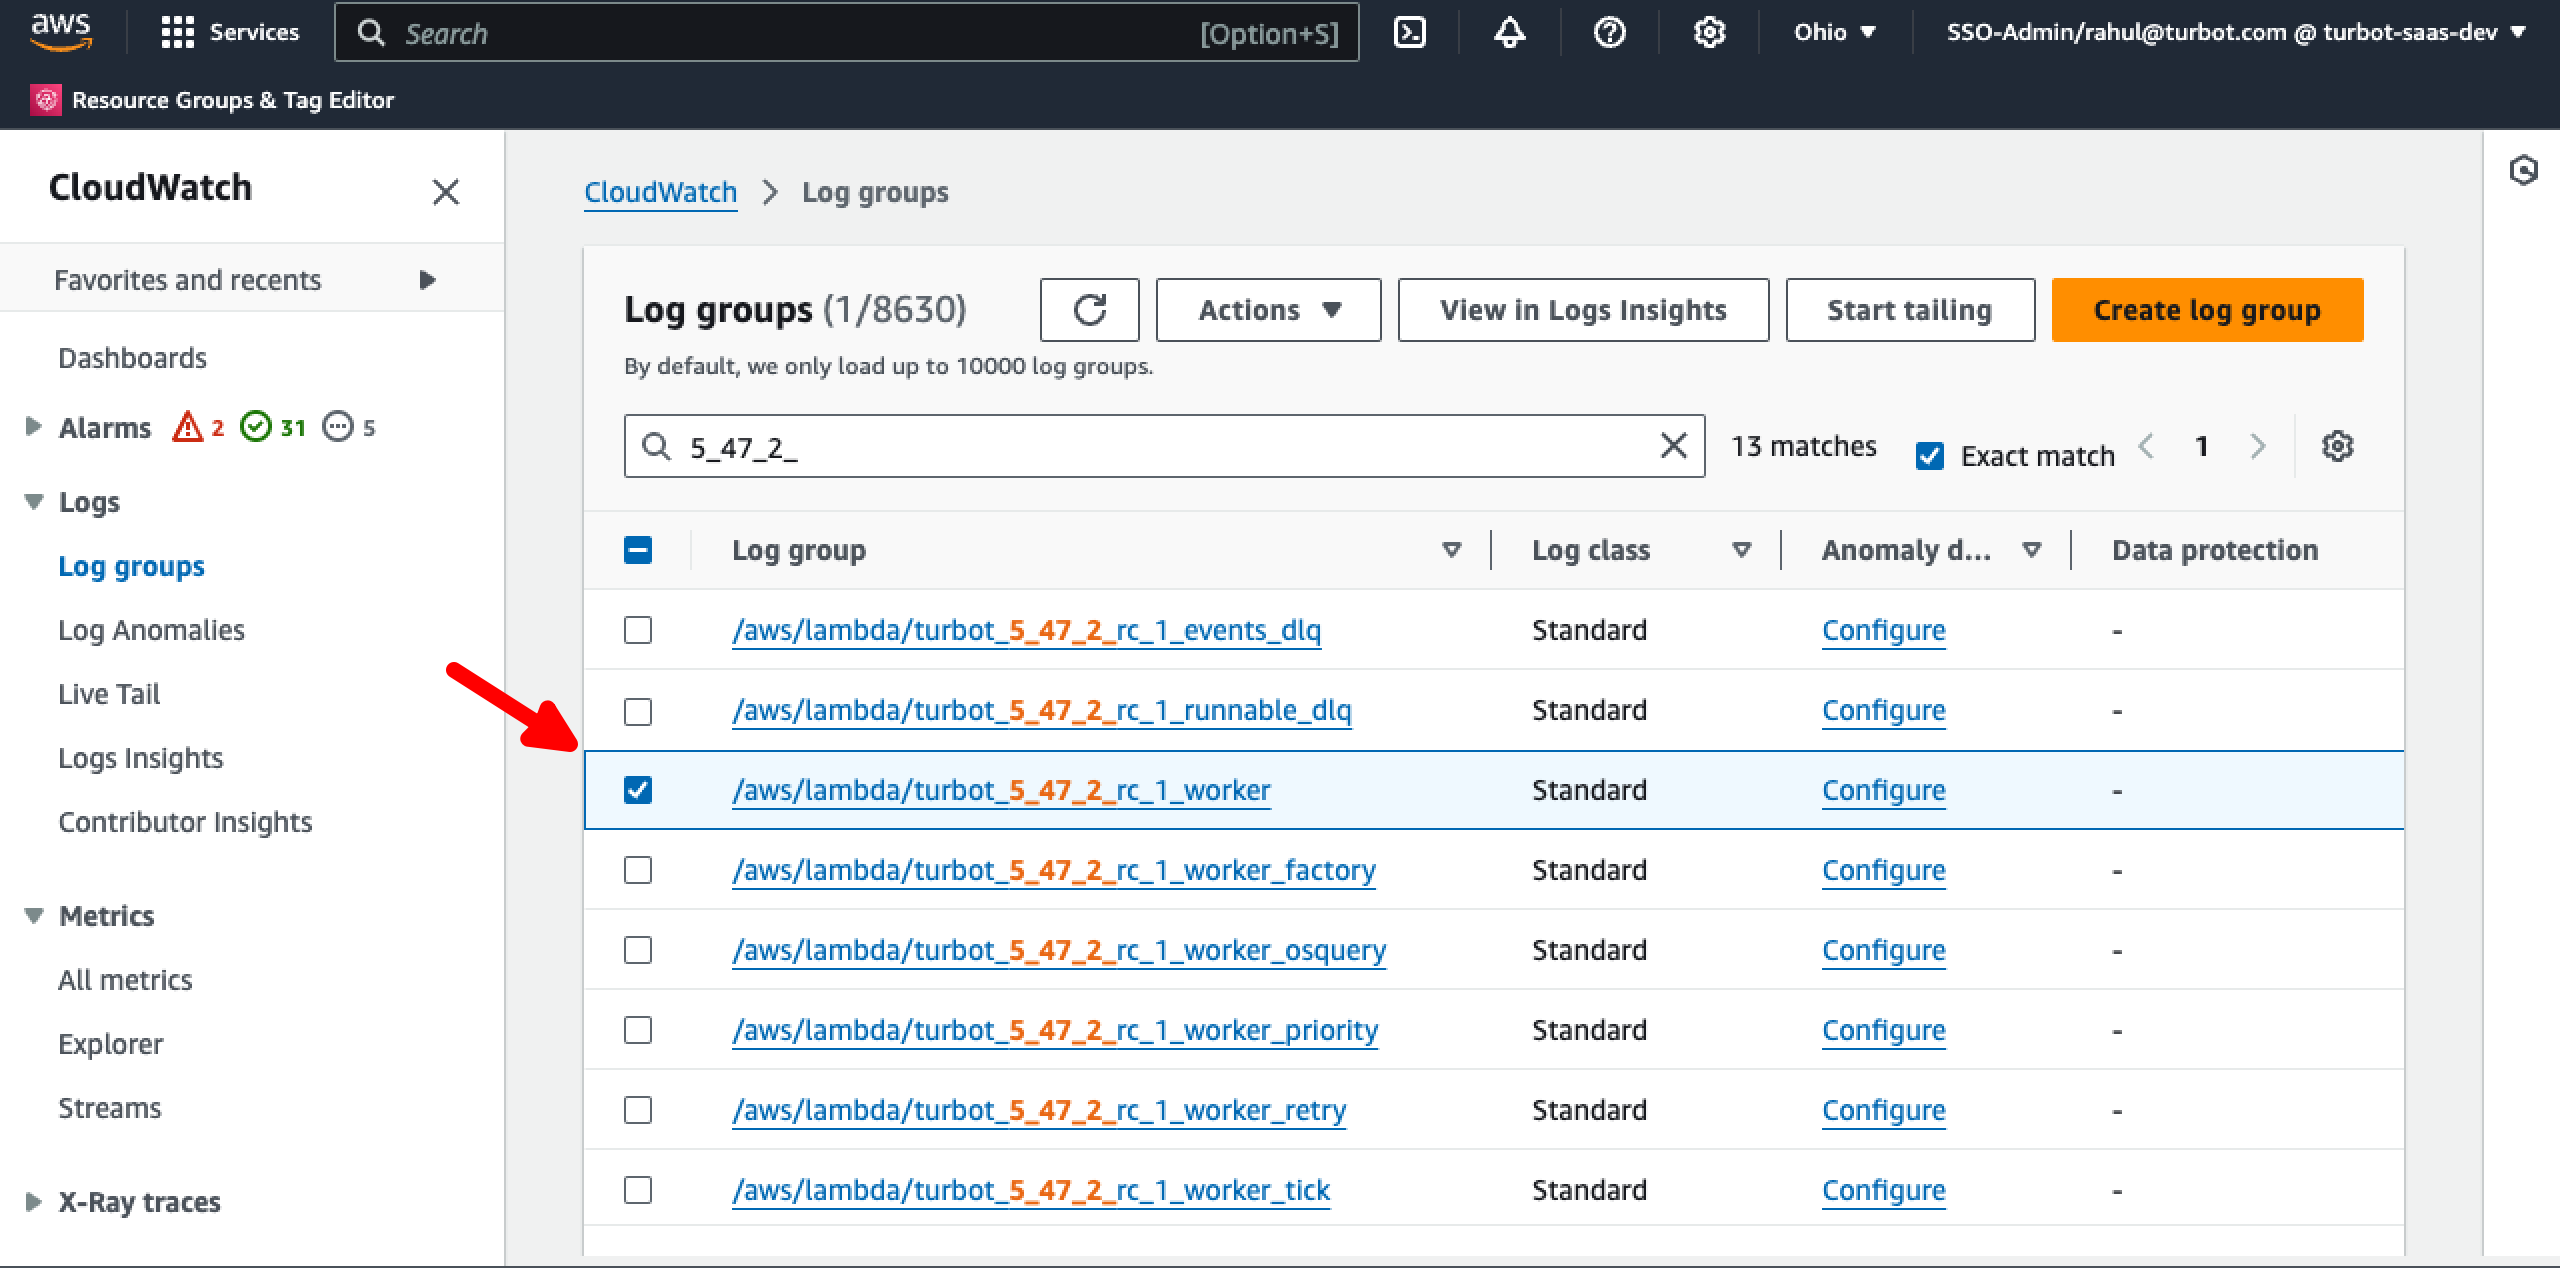
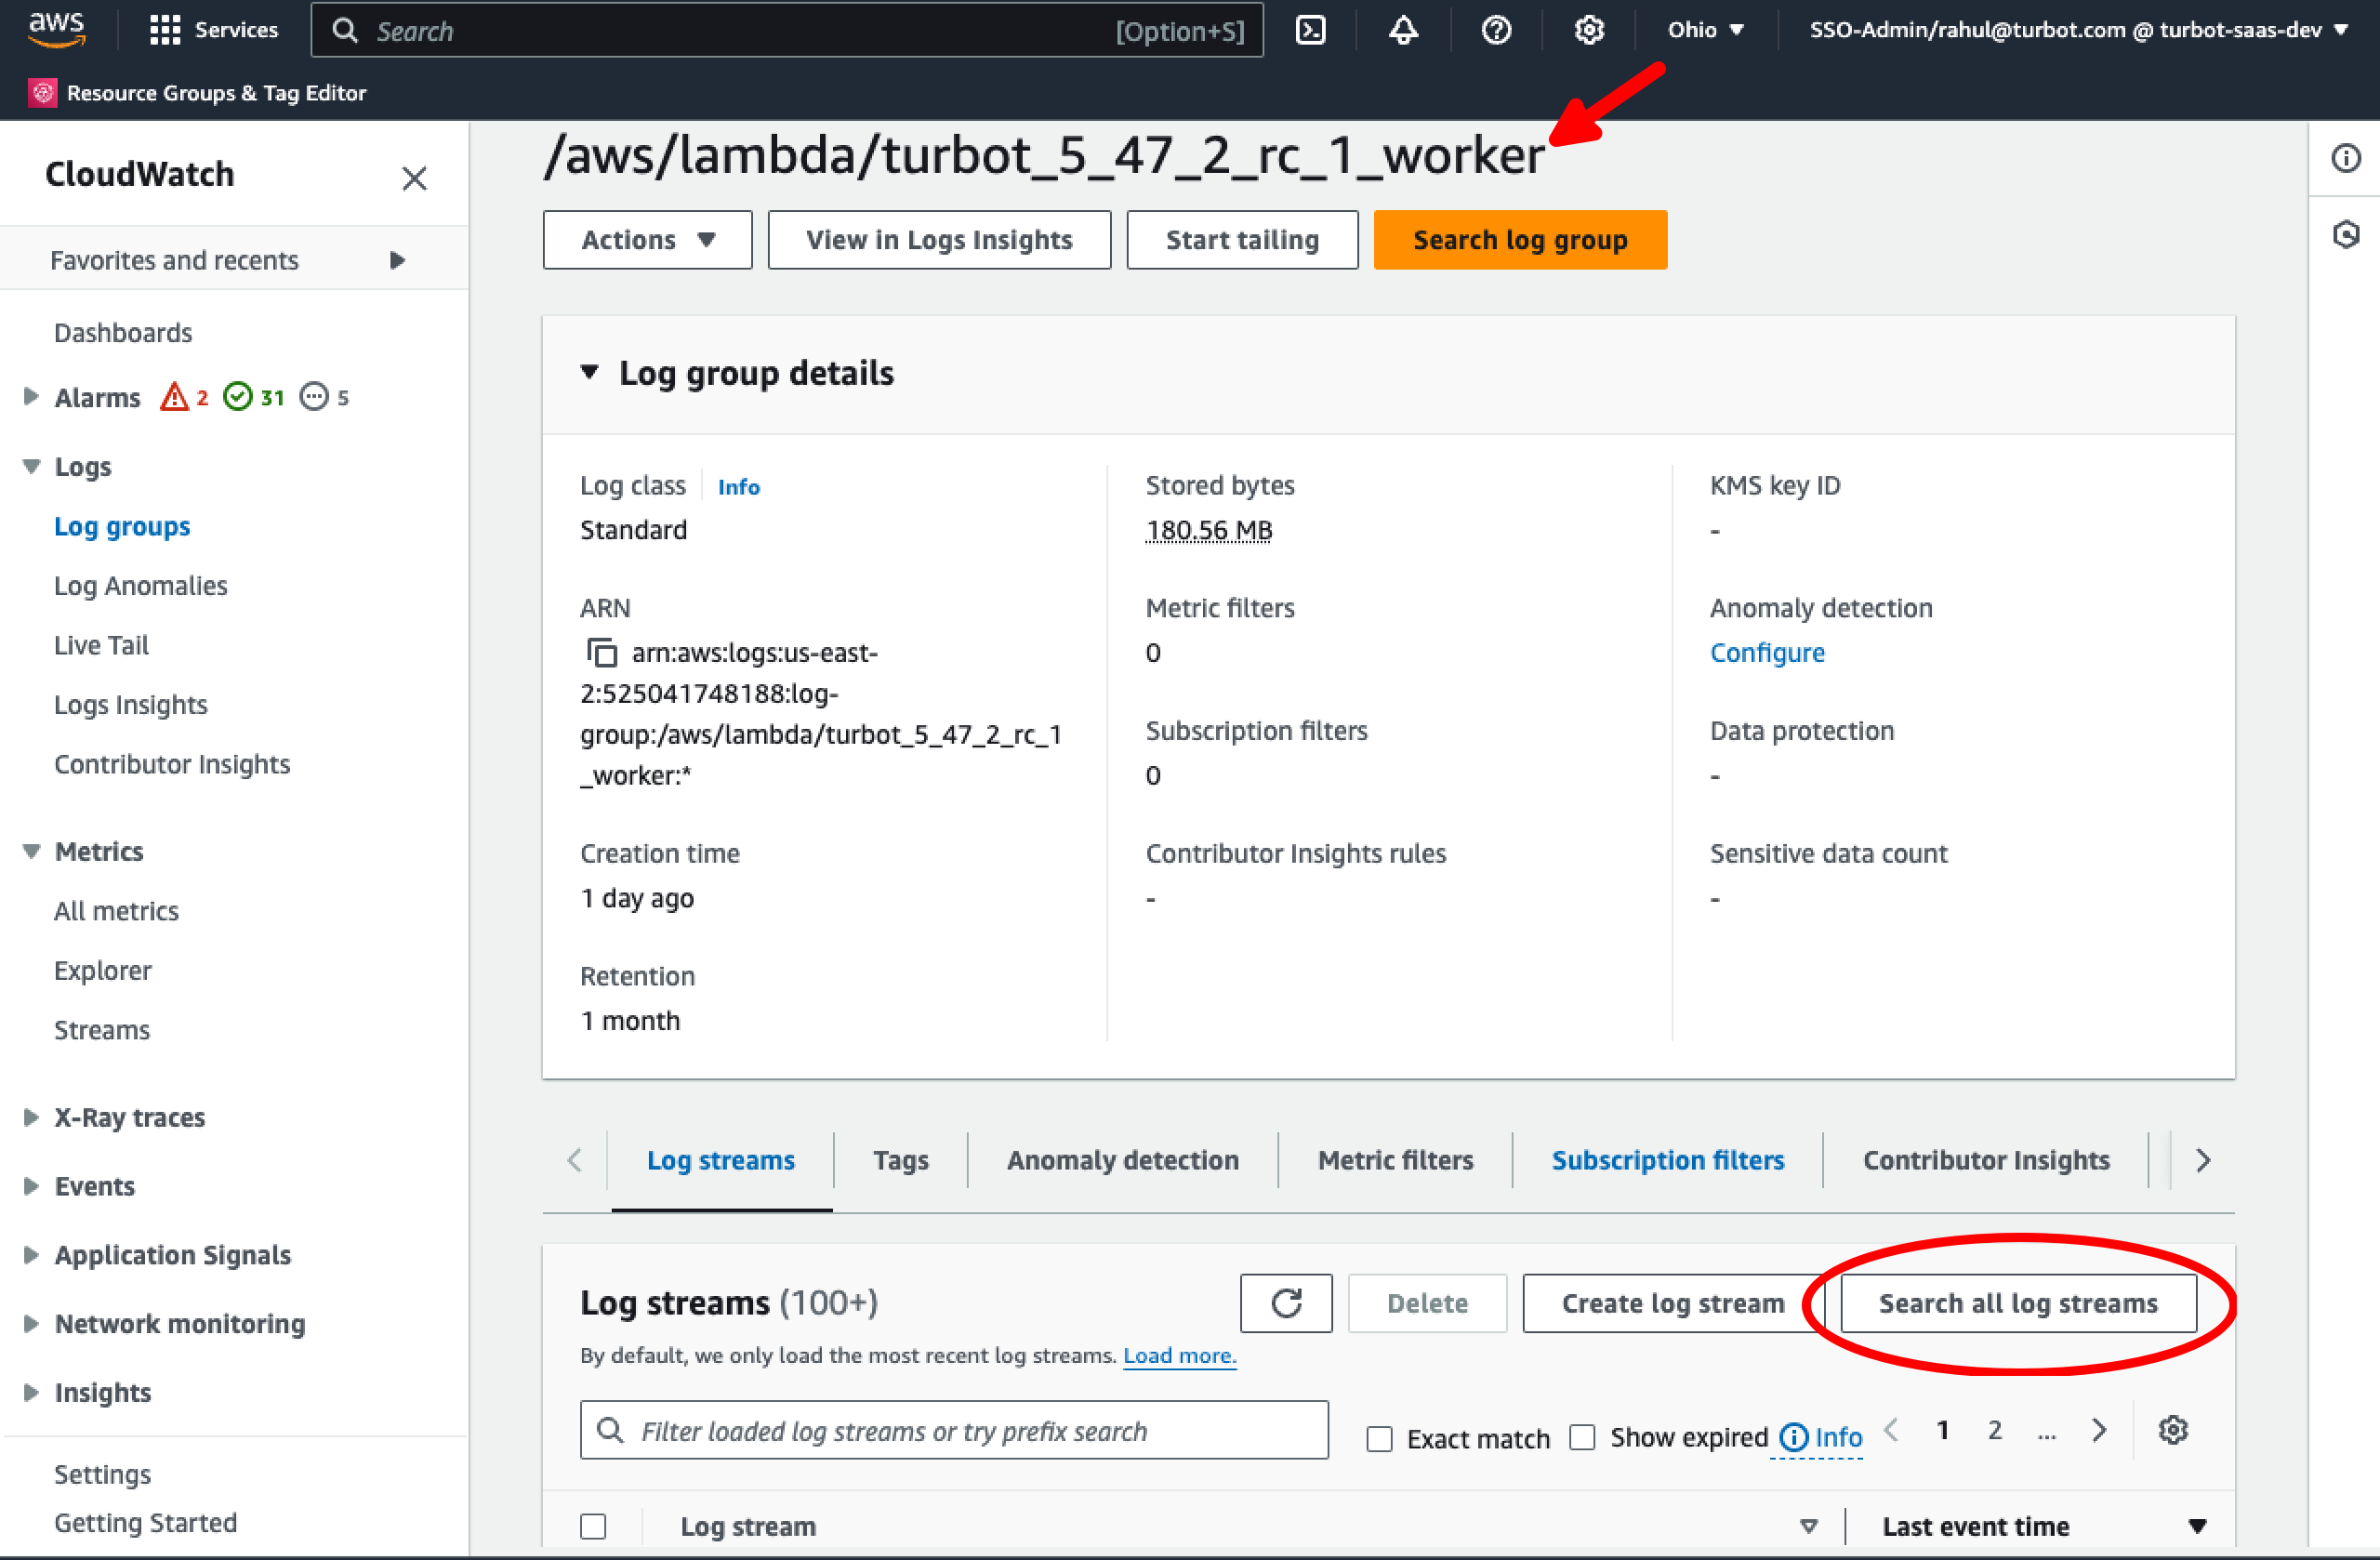
Step 7: Select Log Group
Select the worker log group as indicated in the type field from the error log in the Guardrails console. E.g. select /aws/lambda/turbot_5_47_2_rc_1_worker. Choose Search all log steams.
Step 8: Search Error
Search using the errorId from Step 3 from the Guardrails console control error log.
[!NOTE] Ensure to provide the errorId in double quotes e.g. "3423432-dfdsf-3e331-fgdfgd234234"
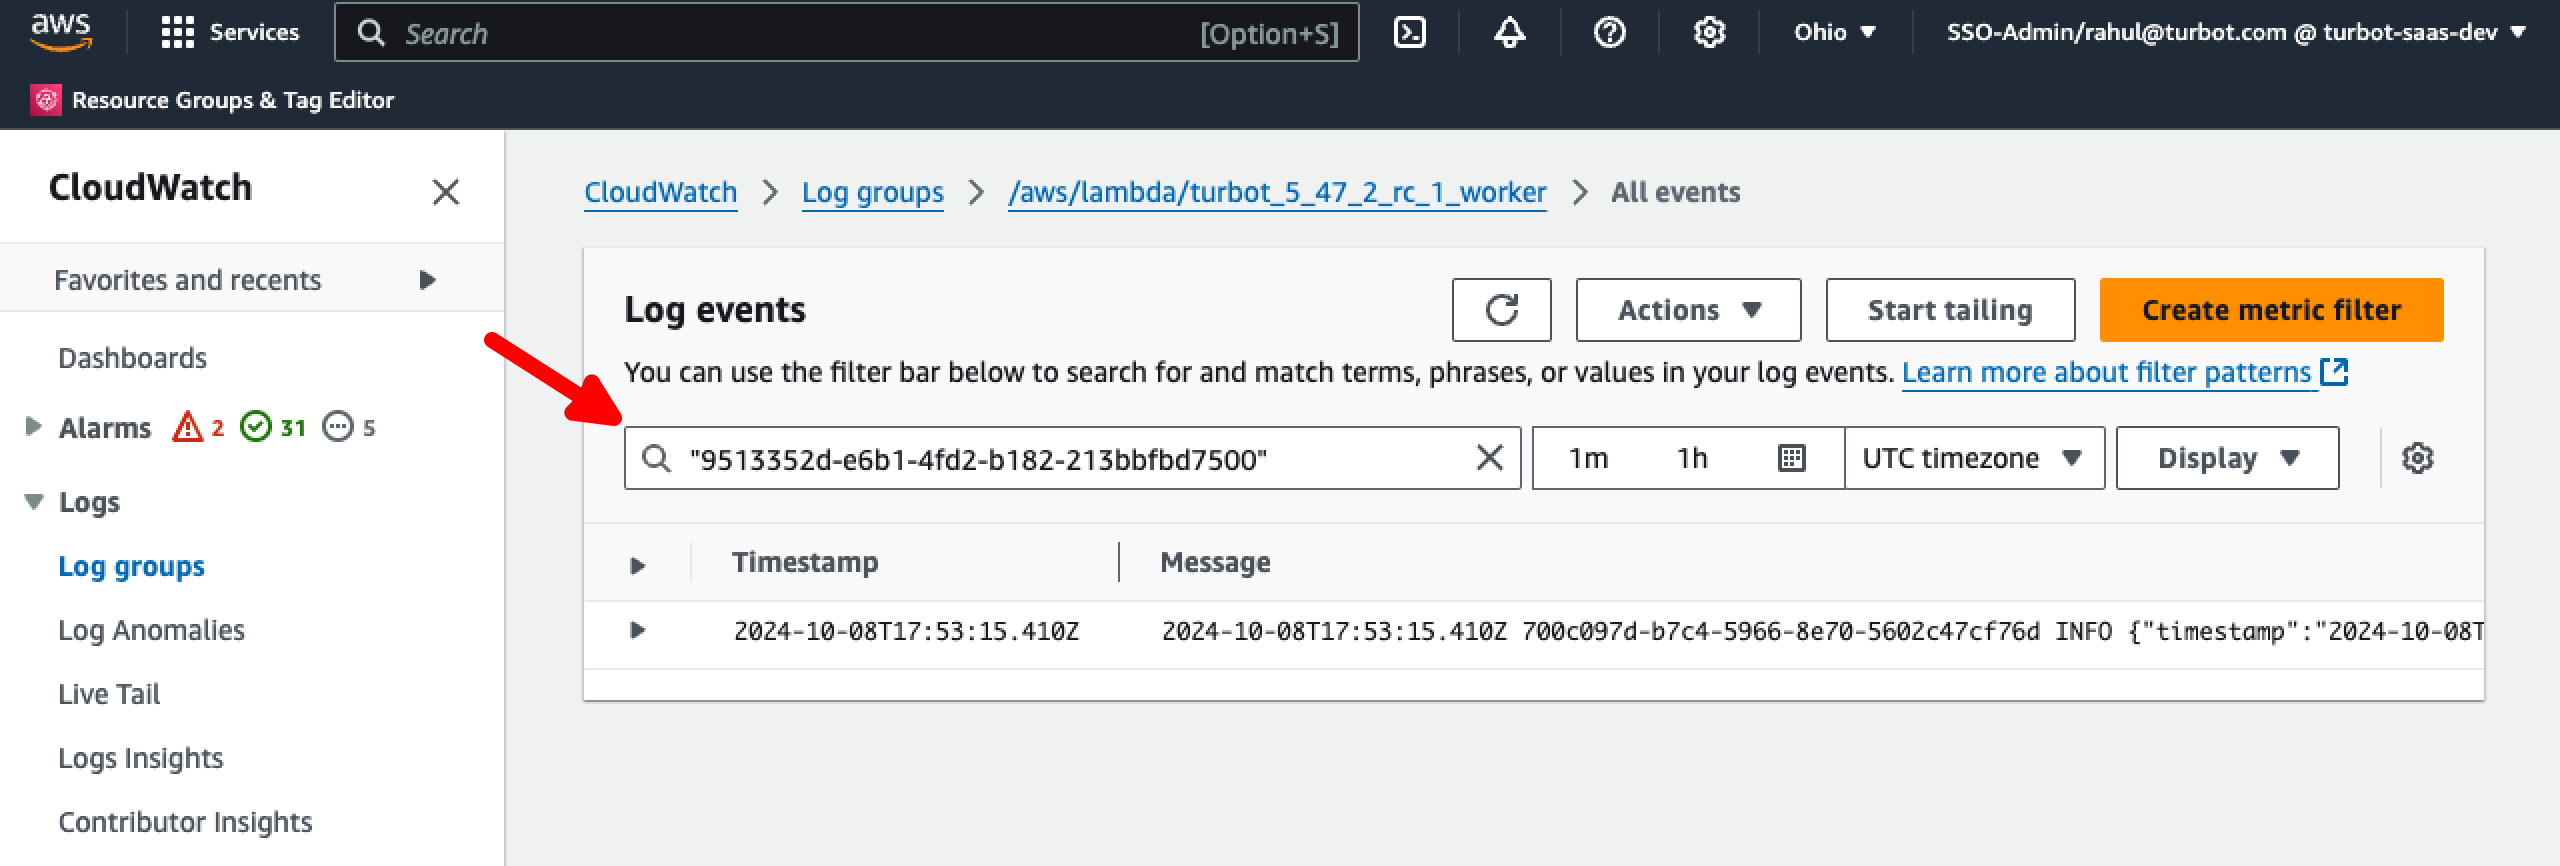
Step 8: Find Error Details
Collapse the search result to view the full error details.
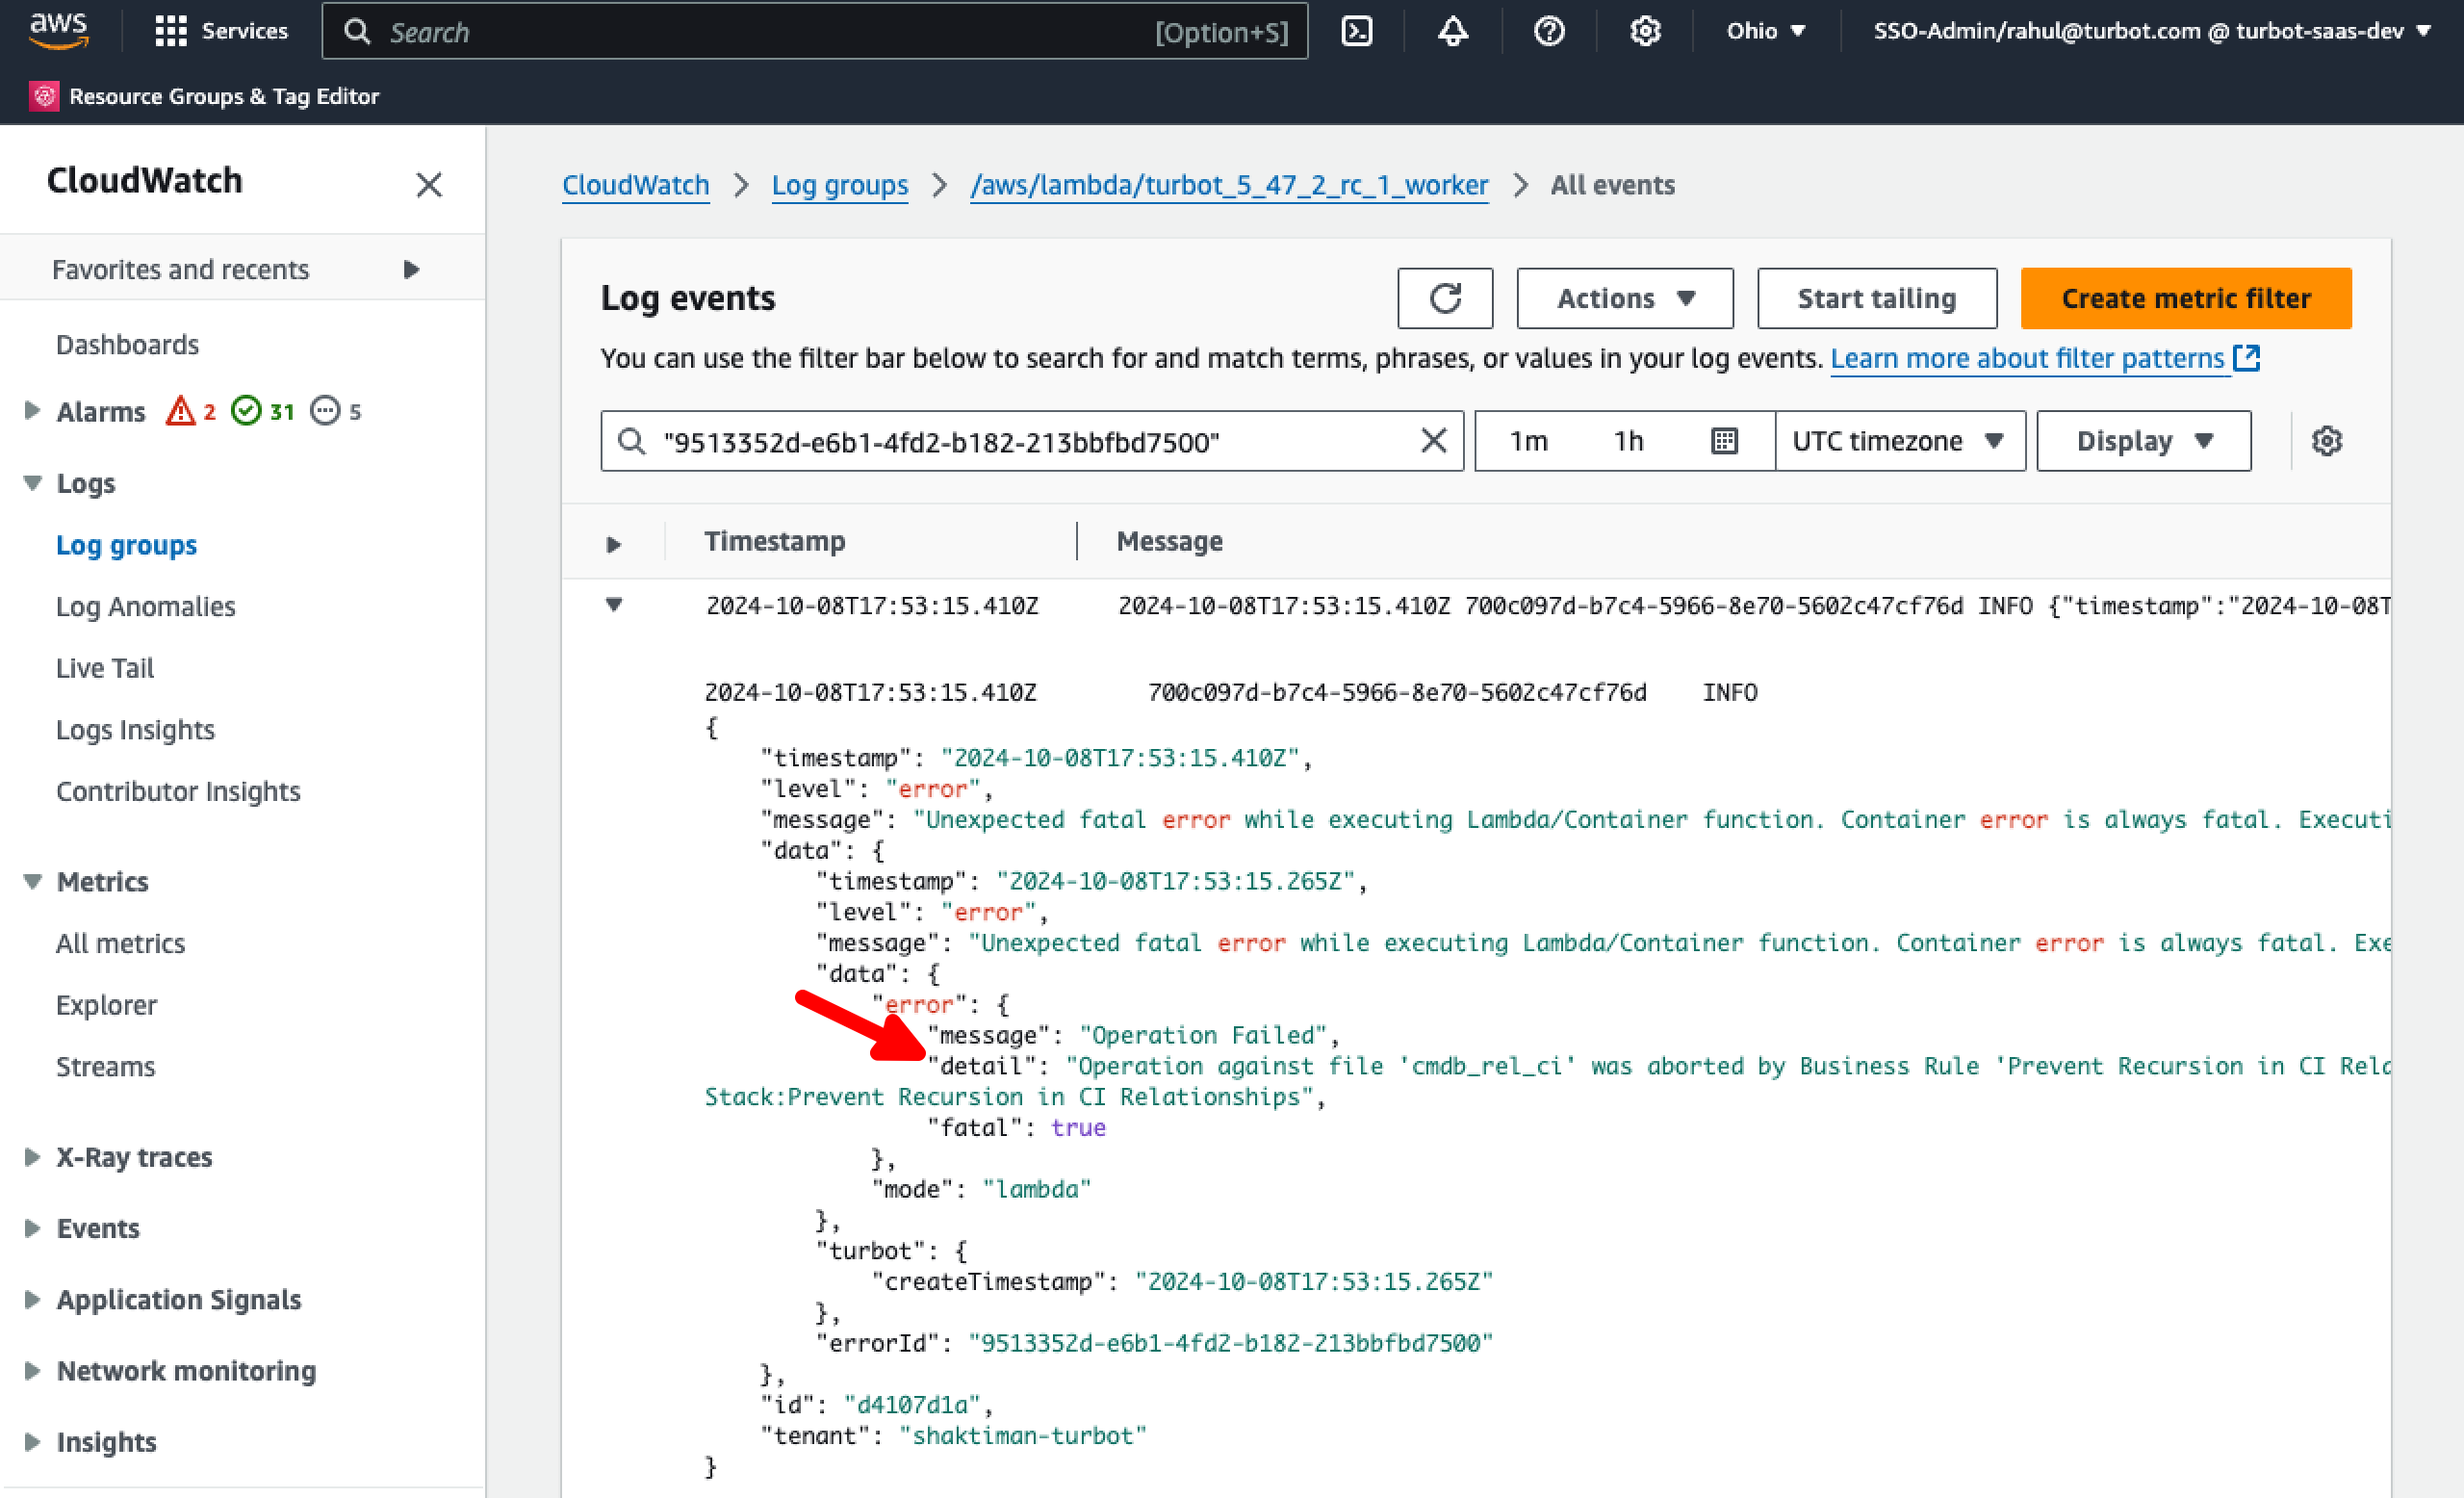
After reviewing the detailed error message, use the information to identify the root cause and take the necessary corrective actions.
If you encounter any further issues, please Open Support Ticket and attach the relevant information to assist you more efficiently.
- A screenshot of the Guardrails control in error.
- Gathered logs and error details from AWS CloudWatch Log Groups.