Connect to Turbot Pipes from Tableau
Connect to Turbot Pipes from Tableau
Tableau is a visual analytics platform that is "transforming the way we use data to solve problems."
Steampipe provides a single interface to all your cloud, code, logs and more. Because it's built on Postgres, Steampipe provides an endpoint that any Postgres-compatible client -- including Tableau -- can connect to.
You can get the information needed to connect to your Turbot Pipes database instance from the Developers tab on the Steampipe page for your workspace.

Once you've tested the connection to Turbot Pipes, you can browse the tables provided by your Steampipe plugins, run queries, and build dashboards.
You can also connect Tableau to Steampipe CLI.
To do that, run steampipe service start --show-password and use the displayed
connection details.
Steampipe service is running:

Database:

  Host(s):            localhost, 127.0.0.1, 172.28.158.171
  Port:               9193
  Database:           steampipe
  User:               steampipe
  Password:           9a**-****-**7e
  Connection string:  postgres://steampipe:9a**-****-**7e@localhost:9193/steampipe
Getting started
Tableau is available on the desktop and the cloud. The examples here use Tableau Online, so start by creating an account there if you don't already have one.
Create a Tableau Project called Steampipe. In the project, create a
workbook. On the Connect to Data screen that pops up, click
Connectors → PostgreSQL and enter your Turbot Pipes connection info.
Require SSL is unchecked by default and that's OK, it's also OK to check it.
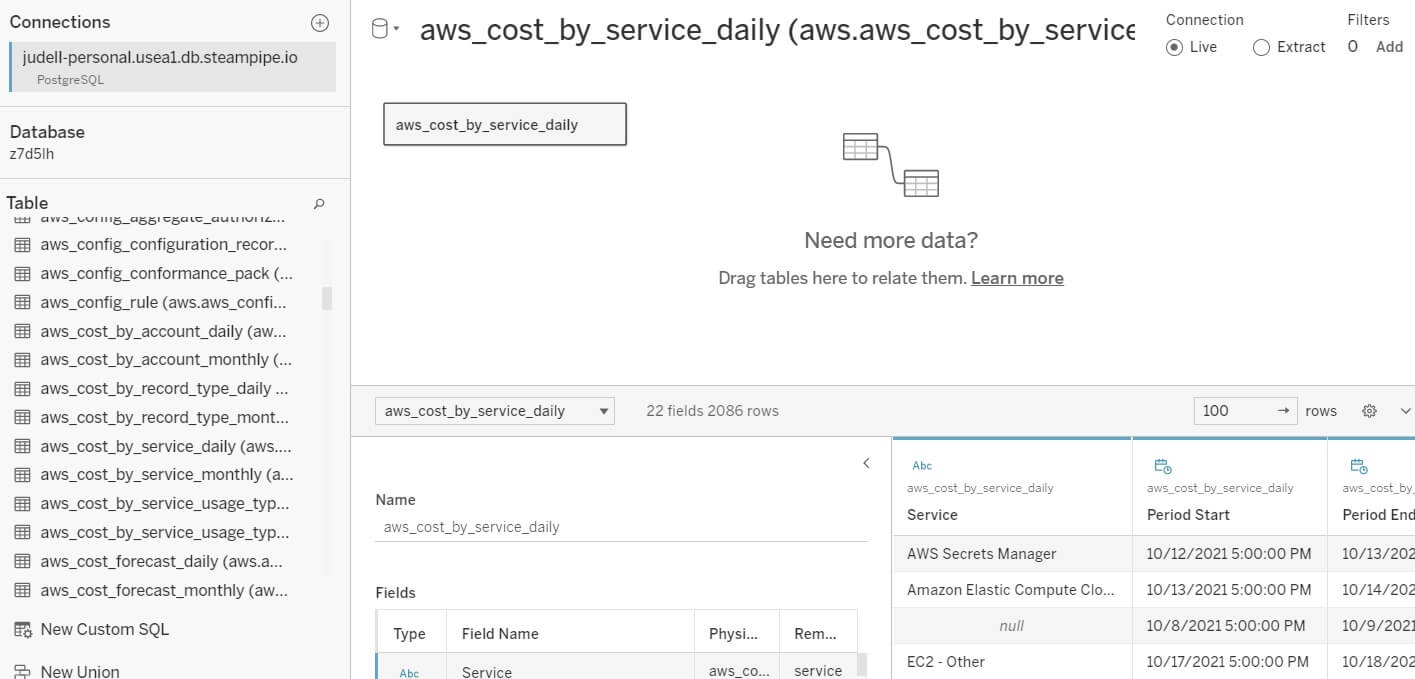
Now drag the aws_cost_by_service_daily table from the sidebar to the canvas,
then click Update Now. Tableau displays the table's schema, and previews the
data.
Summarize and chart one AWS table
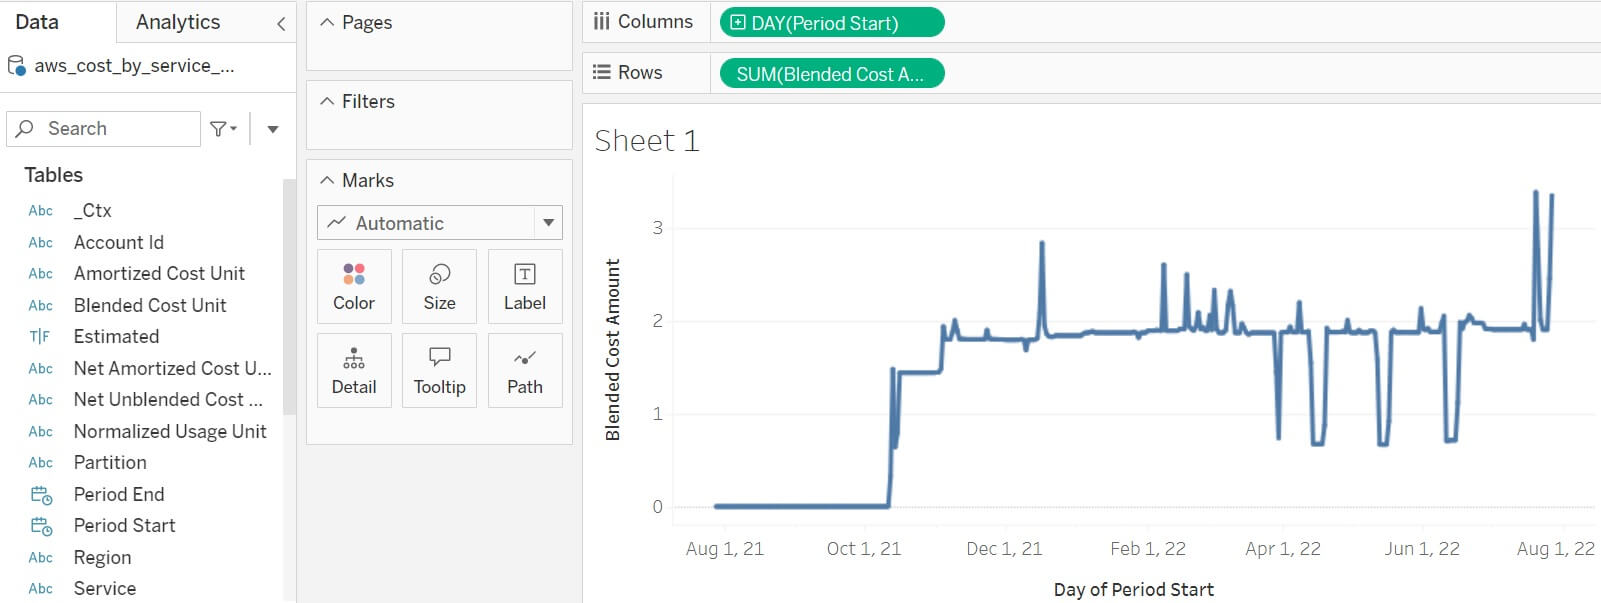
Switch from the workbook's Data Source tab to its Sheet 1 tab. Drag the
Blended Cost Amount column to the Rows shelf, and the Period Start column
to the Columns shelf.
The Period Start indicator defaults to YEAR. Open its dropdown and choose the
second Day option which reports full dates. Tableau charts the daily sums of
costs for all your AWS services.
Publish the workbook as daily cost for all AWS services, and check
Embed password for data source.
Use Tableau-enhanced SQL
Now create another new workbook in the project. Repeat the steps to connect it
to Turbot Pipes, and again drag the aws_cost_by_service_daily table to the
canvas.
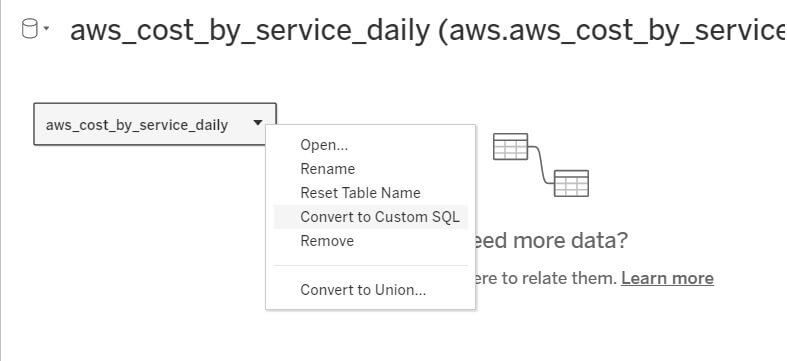
This time, open the aws_cost_by_service dropdown and choose
Convert to Custom SQL.
In the Convert to SQL editor, replace code with the following.
select
 service,
  blended_cost_amount,
  period_start
from
  aws_cost_by_service_daily
where
  service =
order by
  period_start
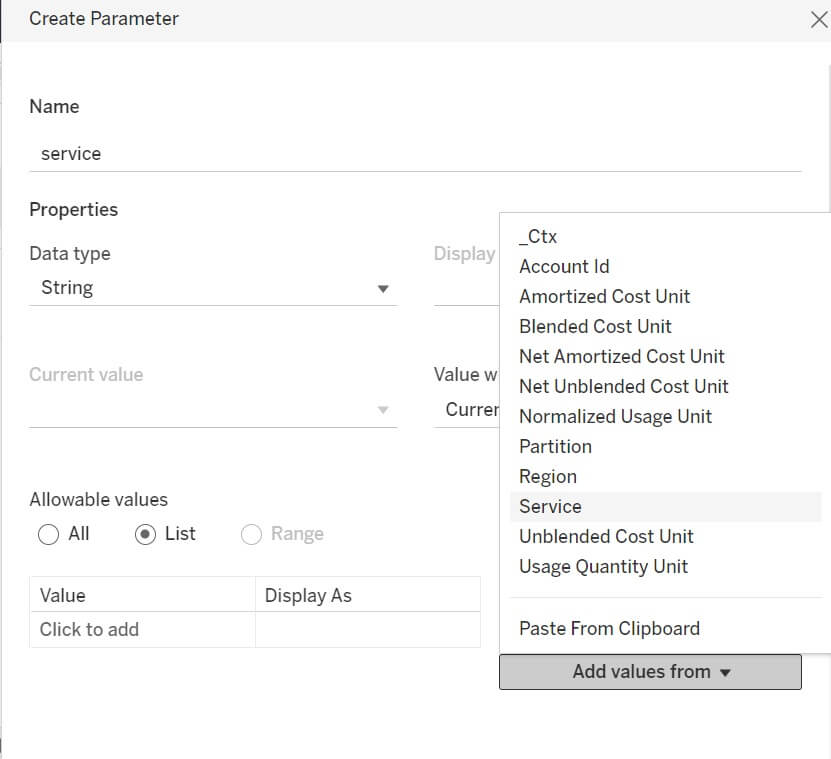
Then click Insert Parameter → Create a New Parameter. Name the parameter
Service, set its type to String, for Allowable Values chose List, click
Add Values From, and choose Service.
Click OK, then (if necessary) edit the Convert to SQL text so it reads like
so.
select
 service,
  blended_cost_amount,
  period_start
from
  aws_cost_by_service_daily
where
   service = <Parameters.Service>
order by
  period_start
Click OK. Then visit the Sheet 1 tab, choose
Parameters → Service → Show Parameter.
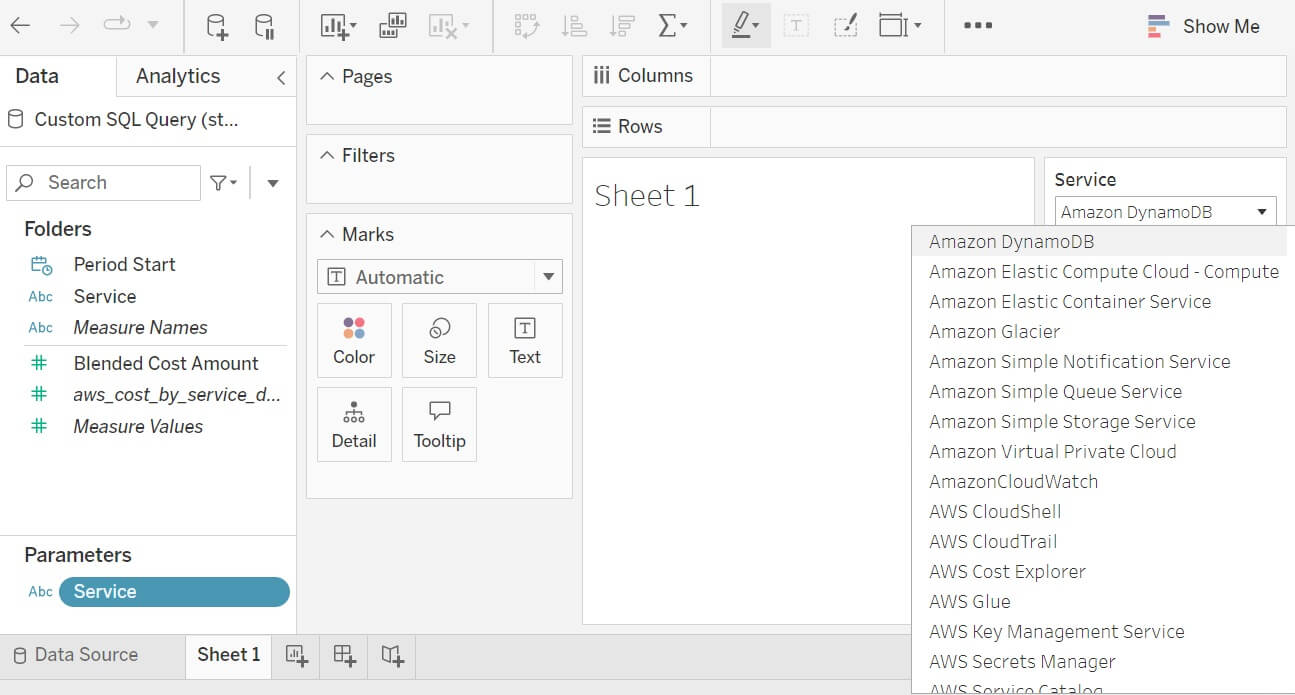
The sheet now has a chooser for AWS services.
As before, drag Blended Cost Amount to the Rows shelf, drag Period Start
to the Columns Shelf, and set Period Start to day.
Tableau charts the selected service.
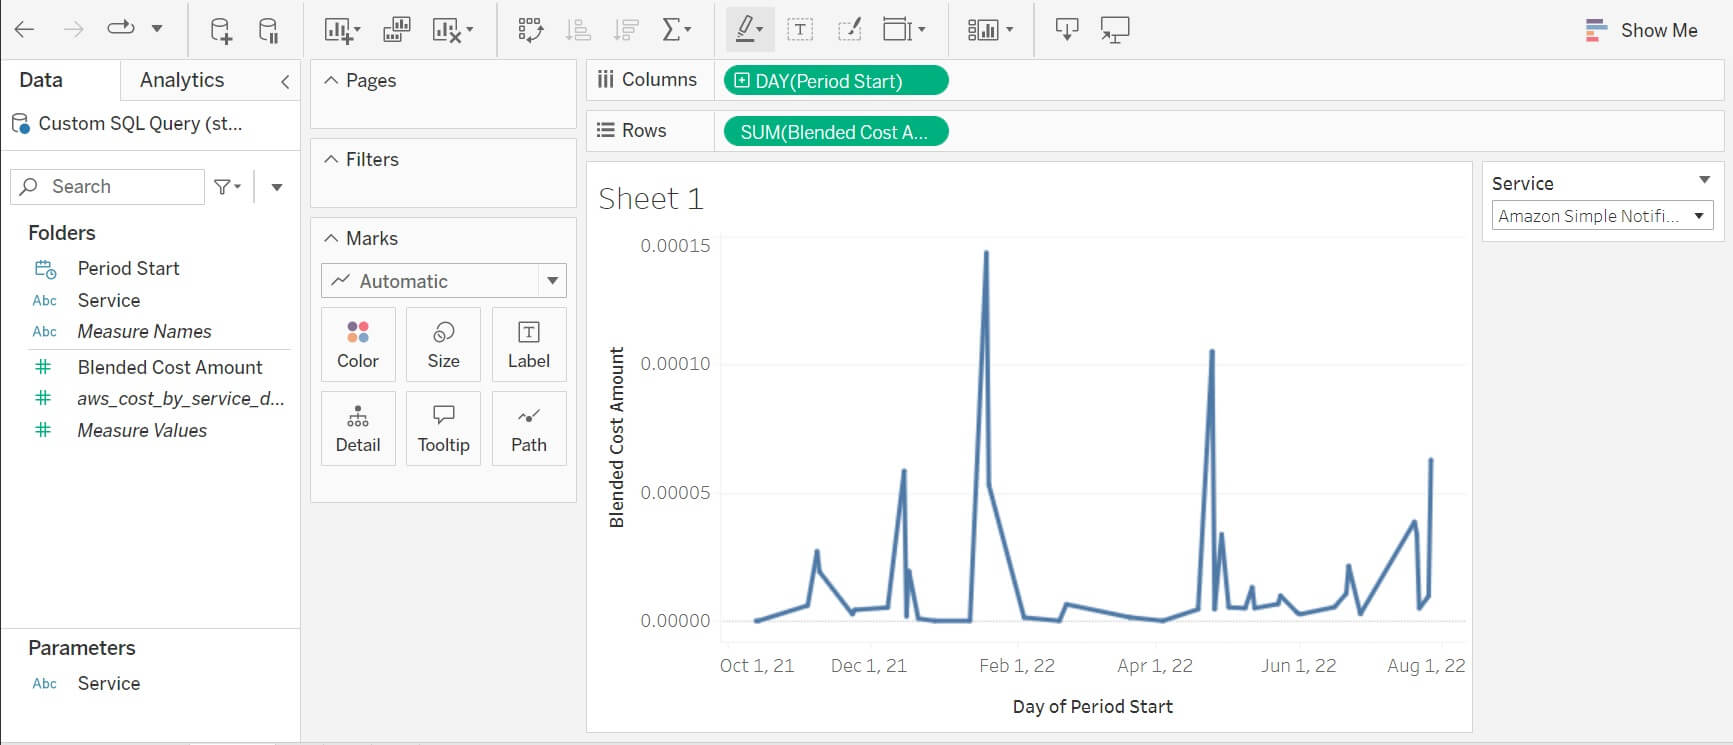
Publish the workbook as daily cost for selected service, again with
Embed password for data source.
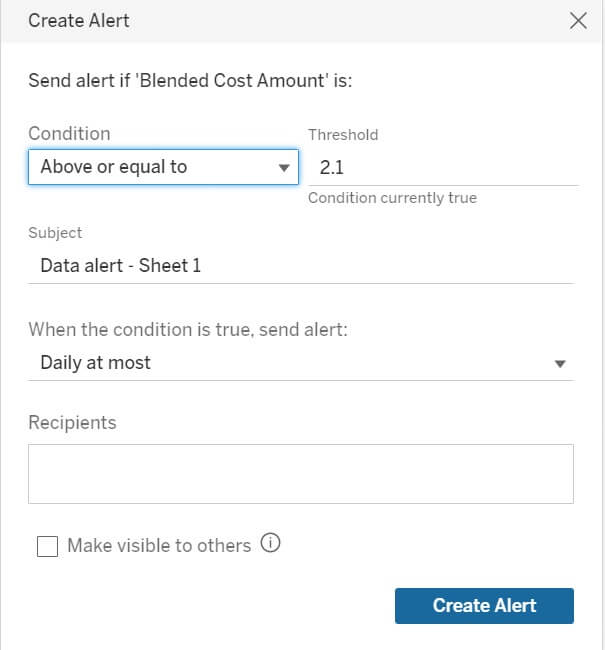
Send alerts
Open the project (Explore → Steampipe), reopen the
daily cost for all AWS services workbook, reopen Sheet 1, and click
Watch → Alerts.
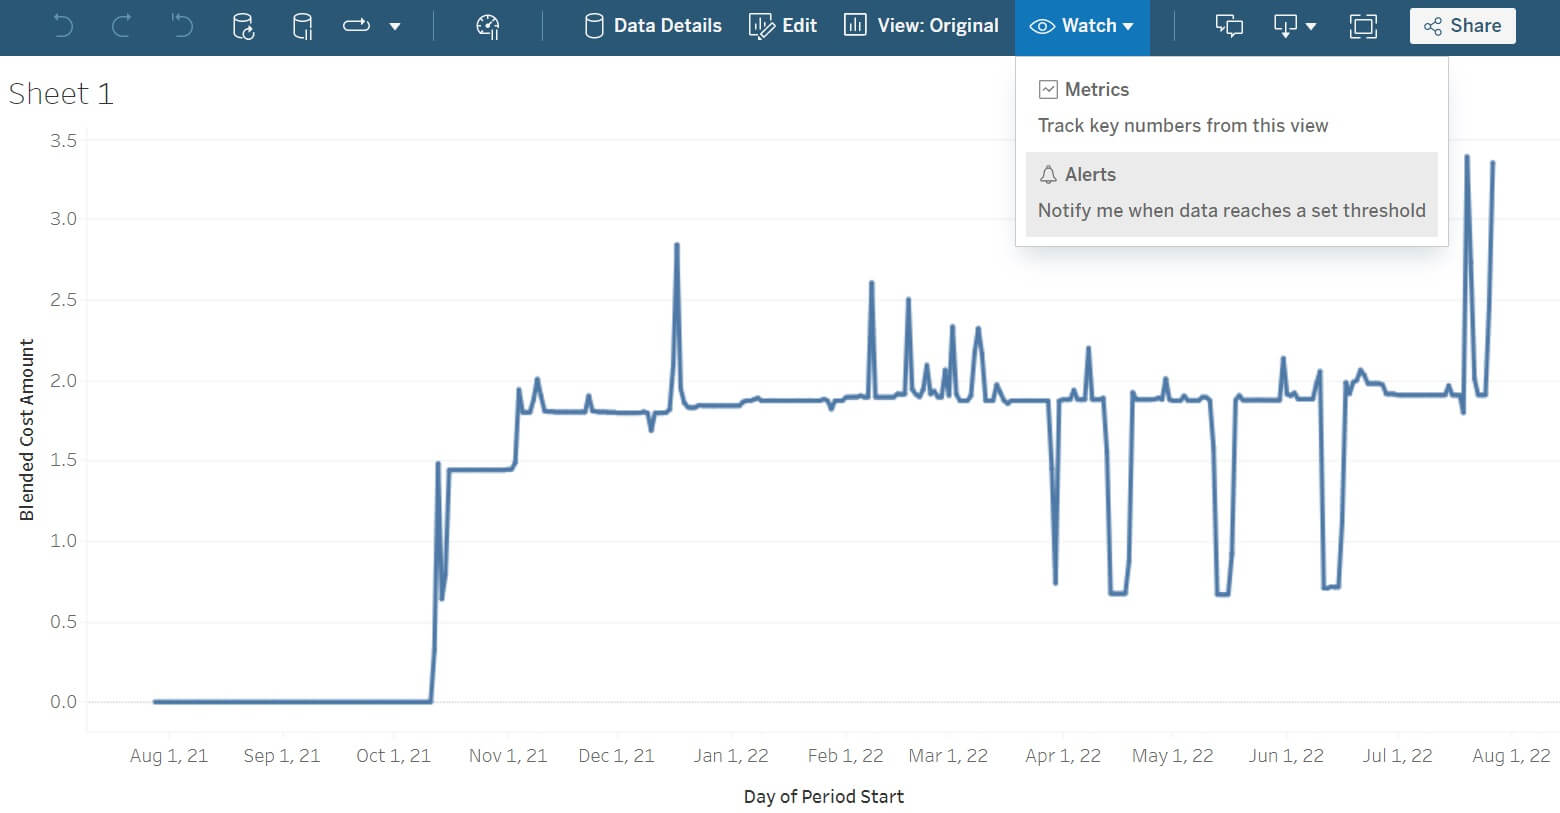
Select the Blended Cost Amount axis.
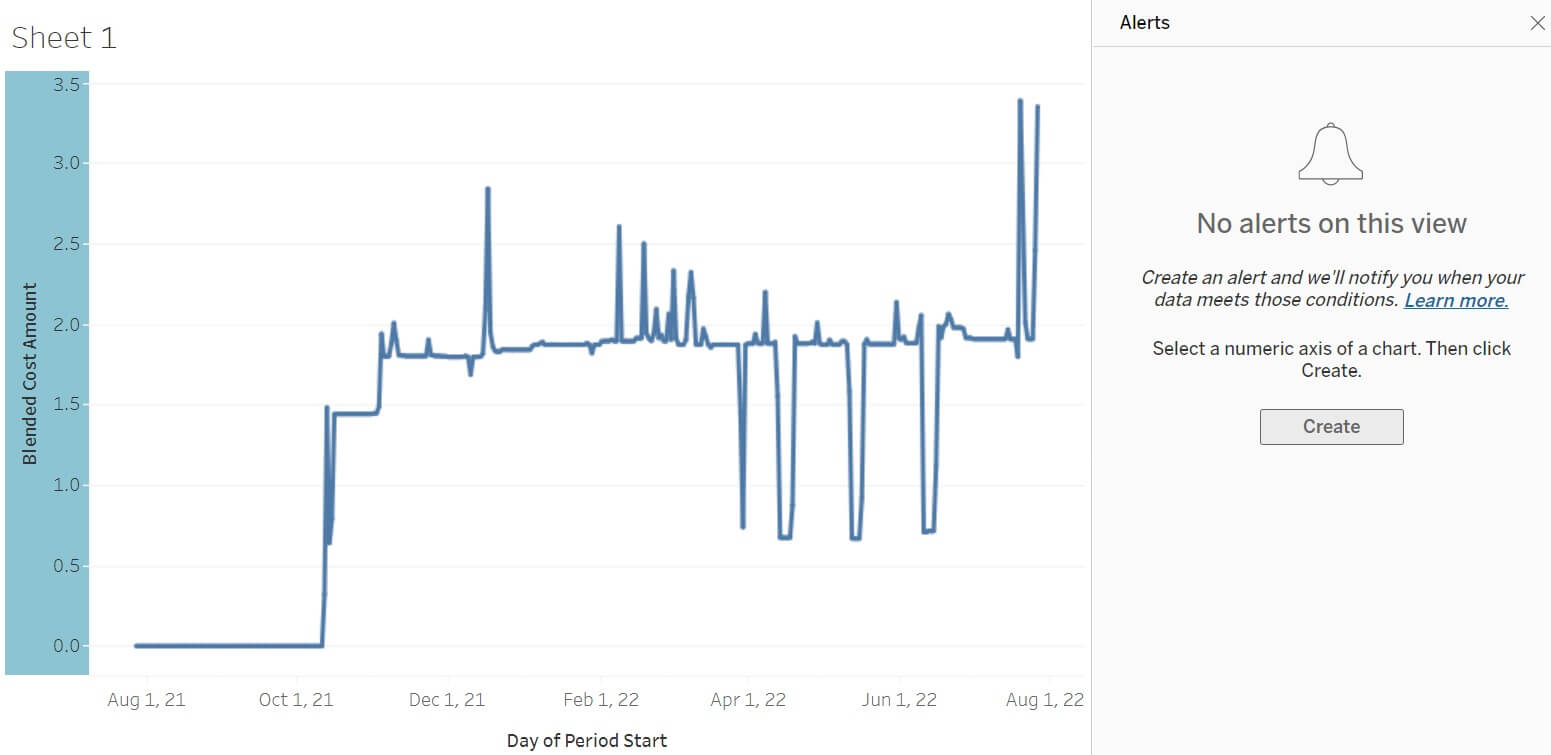
Then click Create and fill in the details: Condition, Threshold, etc.
Summary
With Tableau and Turbot Pipes you can:
Summarize, filter, and chart the tables in your Turbot Pipes workspace
Create interactive widgets driven by data in those tables
Send query-driven alerts