Connect to Turbot Pipes from Apache Superset
Connect to Turbot Pipes from Apache Superset
Apache Superset is a data exploration and visualization platform that connects to many databases, including Postgres, and enables users to explore, query, and visualize data.
Steampipe provides a single interface to all your cloud, code, logs and more. Because it's built on Postgres, Steampipe provides an endpoint that any Postgres-compatible client -- including Apache Superset -- can connect to.
You can get the information needed to connect to your Turbot Pipes database instance from the Developers tab on the Steampipe page for your workspace.

Connect to Steampipe CLI from Apache Superset
You can also connect Apache Superset to
Steampipe CLI. To do that, run
steampipe service start --show-password and use the displayed connection
details.
Steampipe service is running:

Database:

  Host(s):            localhost, 127.0.0.1, 192.168.29.204
  Port:               9193
  Database:           steampipe
  User:               steampipe
  Password:           99**_****_**8c
  Connection string:  postgres://steampipe:99**_****_**8c@localhost:9193/steampipe
Getting started
Apache Superset is a free to use open-source application that runs in a container, or on the desktop. Here we run it locally using docker compose.
With Apache Superset up and running, open a browser to http://localhost:8080/.
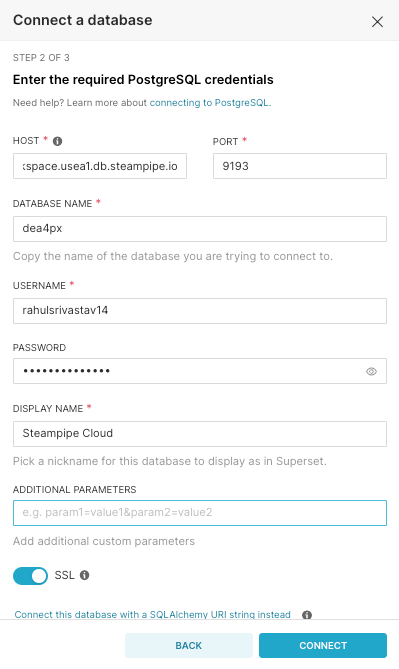
Click on Database Connections under settings on the top right corner, then
click +Database and select PostgreSQL. Enter the connection details, toggle
the SSL mode to Require and click connect.
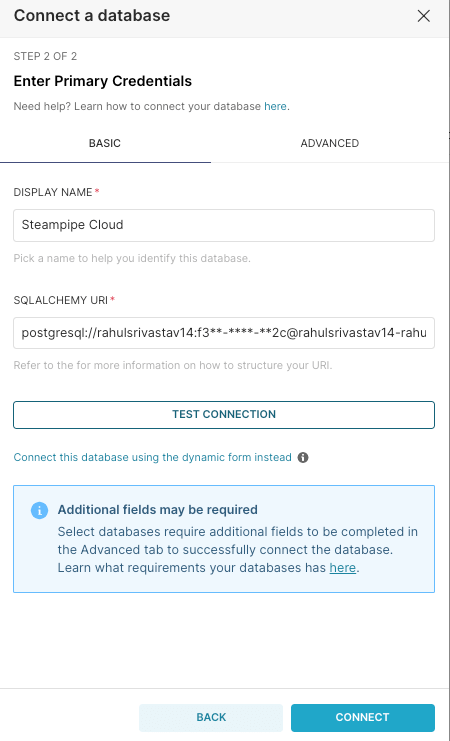
Alternatively, you can connect to the database using the SQLALCHEMY URI option
and use the connection string.
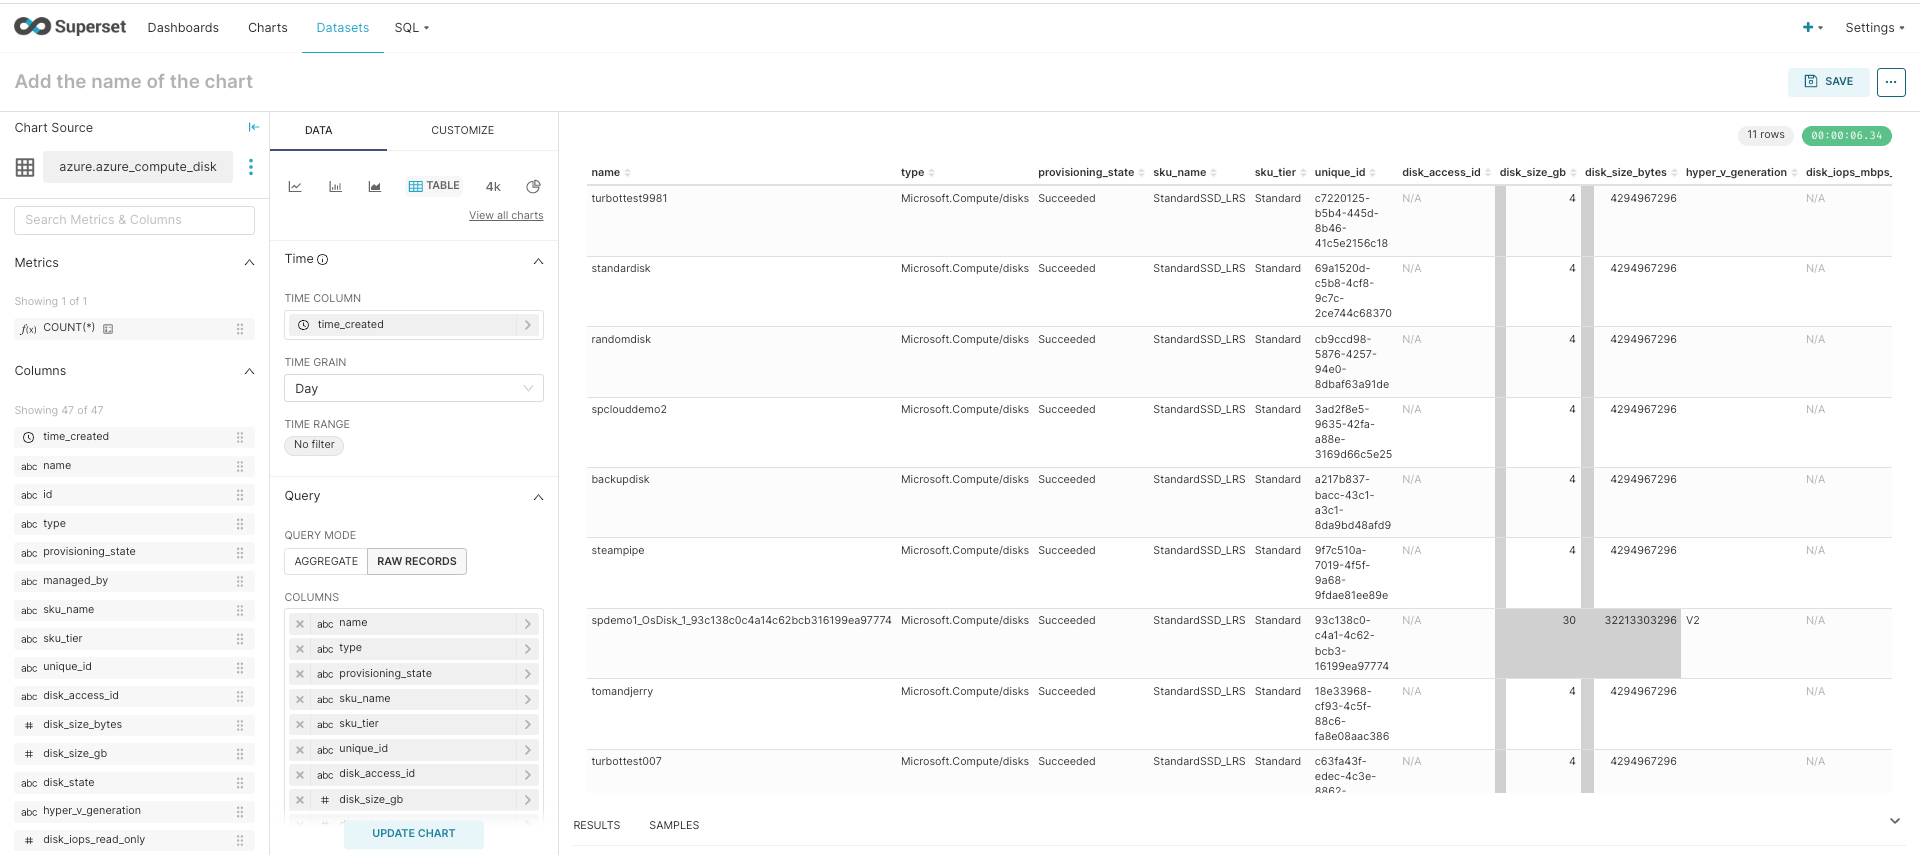
Now add a Dataset which is a representation of a table you want exposed for
querying. To do that click on +Dataset from the Datasets tab and update the
database, schema and table details. Here we add a dataset using the
azure_compute_disk table to list the Azure compute disks.

To create the table, select the azure_compute_disk dataset, set the
QUERY MODE to RAW RECORDS, update the columns to be displayed and click
CREATE CHART. Superset will then preview the data.
Create charts with custom queries.
You can augment your SQL queries using Superset's SQL Lab (under the SQL tab)
and visualize them with a suite of charts. To try that, click SQL Lab and
paste this SQL that returns the number of compute disks per region.
select
  region,
  count(name)
from
  azure_compute_disk
group by
  region;
Once the result is returned, click CREATE CHART and select PIE CHART. Now
update the region and count columns into the dimensions field, set the metric
field to aggregate MAX count and click UPDATE CHART. Custom queries can also
be saved as datasets.

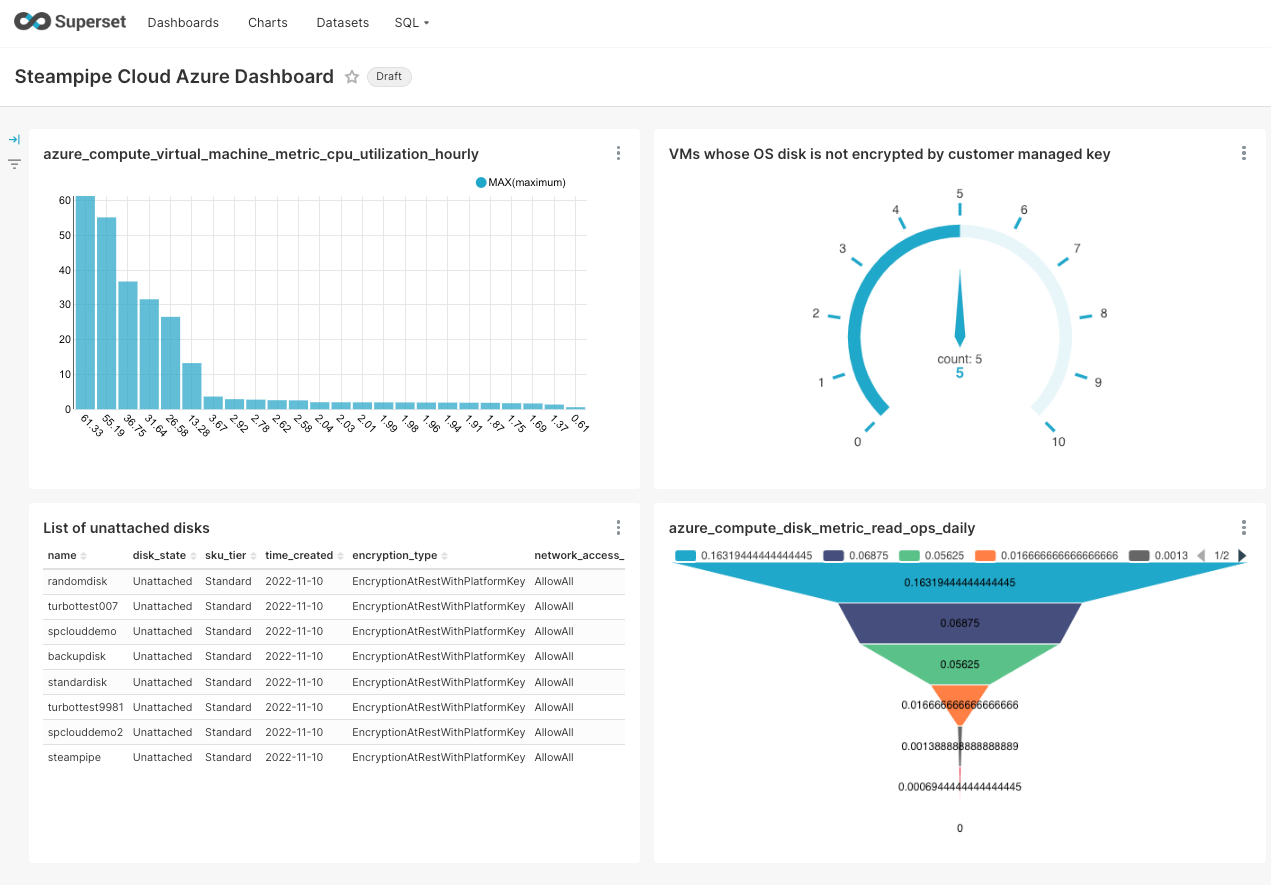
Create a dashboard to analyze resources
Charts that display data are the building blocks of Apache Superset dashboards.
We'll focus here on a creating a dashboard that monitors the Azure VMs and
disks. To begin, click +Dashboard from the Dashboards tab, and click
+Create a New Chart. Then create datasets and charts with
azure_compute_virtual_machine_metric_cpu_utilization_hourly and
azure_compute_disk_metric_read_ops_daily tables. Finally paste these queries
to create dataset charts for VMs with disks not encrypted by customer-managed
key, and for unattached disks.
select
  count(disk.encryption_type)
from
  azure_compute_disk as disk
  join azure_compute_virtual_machine as vm on disk.name = vm.os_disk_name
where
  not disk.encryption_type = 'EncryptionAtRestWithCustomerKey'
select
  name,
  disk_state,
  sku_tier,
  time_created,
  encryption_type,
  network_access_policy
from
  azure_compute_disk
where
  disk_state = 'Unattached';
Superset provides a variety of chart types. Here we use Bar Chart for
azure_compute_virtual_machine_metric_cpu_utilization_hourly, Funnel Chart for
azure_compute_disk_metric_read_ops_daily, Table for list of unattached disks
and Gauge Chart for VMs with disks not encrypted by customer managed key. The
dashboard can also be saved as an image by simply clicking on
Download as image from the dashboard menu.
Summary
With Apache Superset and Turbot Pipes you can:
-
View tables in your Turbot Pipes workspace
-
Write custom queries for those tables
-
Create interactive dashboards driven by your tables and queries