Connect to Turbot Pipes from Azure Data Studio
Connect to Turbot Pipes from Azure Data Studio
Azure Data Studio is a cross-platform database tool for data exploration and visualization that connects to many databases, including Postgres, and enables users to monitor, query, and visualize data.
Steampipe provides a single interface to all your cloud, code, logs and more. Because it's built on Postgres, Steampipe provides an endpoint that any Postgres-compatible client -- including Azure Data Studio -- can connect to.
You can get the information needed to connect to your Turbot Pipes database instance from the Developers tab on the Steampipe page for your workspace.

Connect to Steampipe CLI from Azure Data Studio
You can also connect Azure Data Studio to
Steampipe CLI. To do that, run
steampipe service start --show-password and use the displayed connection
details.
Steampipe service is running:
Database:
  Host(s):            localhost, 127.0.0.1, 192.168.29.204
  Port:               9193
  Database:           steampipe
  User:               steampipe
  Password:           99**_****_**8c
  Connection string:  postgres://steampipe:99**_****_**8c@localhost:9193/steampipe
Getting started
Azure Data Studio is available to use on the desktop. First let's create a Turbot Pipes connection from Azure Data Studio, then chart Apple's hourly price history using the Finance plugin.
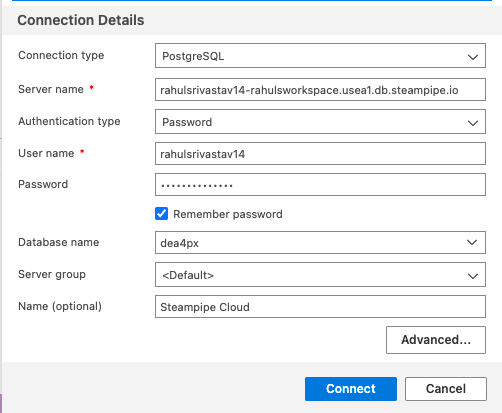
To create a new connection, first install the
PostgreSQL
extension from the Extensions tab in the sidebar. Click on New Connection
from the Connections tab, select PostgreSQL as the Connection type and add the
connection details. Click Advanced and update the Port number and set the SSL
mode to Require.
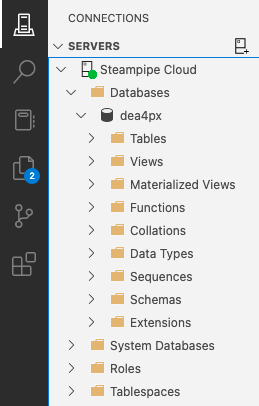
Once the database is connected, you can load plugins and the tables from the navigation bar.
Now to create a chart, first right click on the database name, select
New Query and paste this query.
select
  close
from
  finance_quote_hourly
where
  symbol = 'AAPL'
order by
  timestamp desc
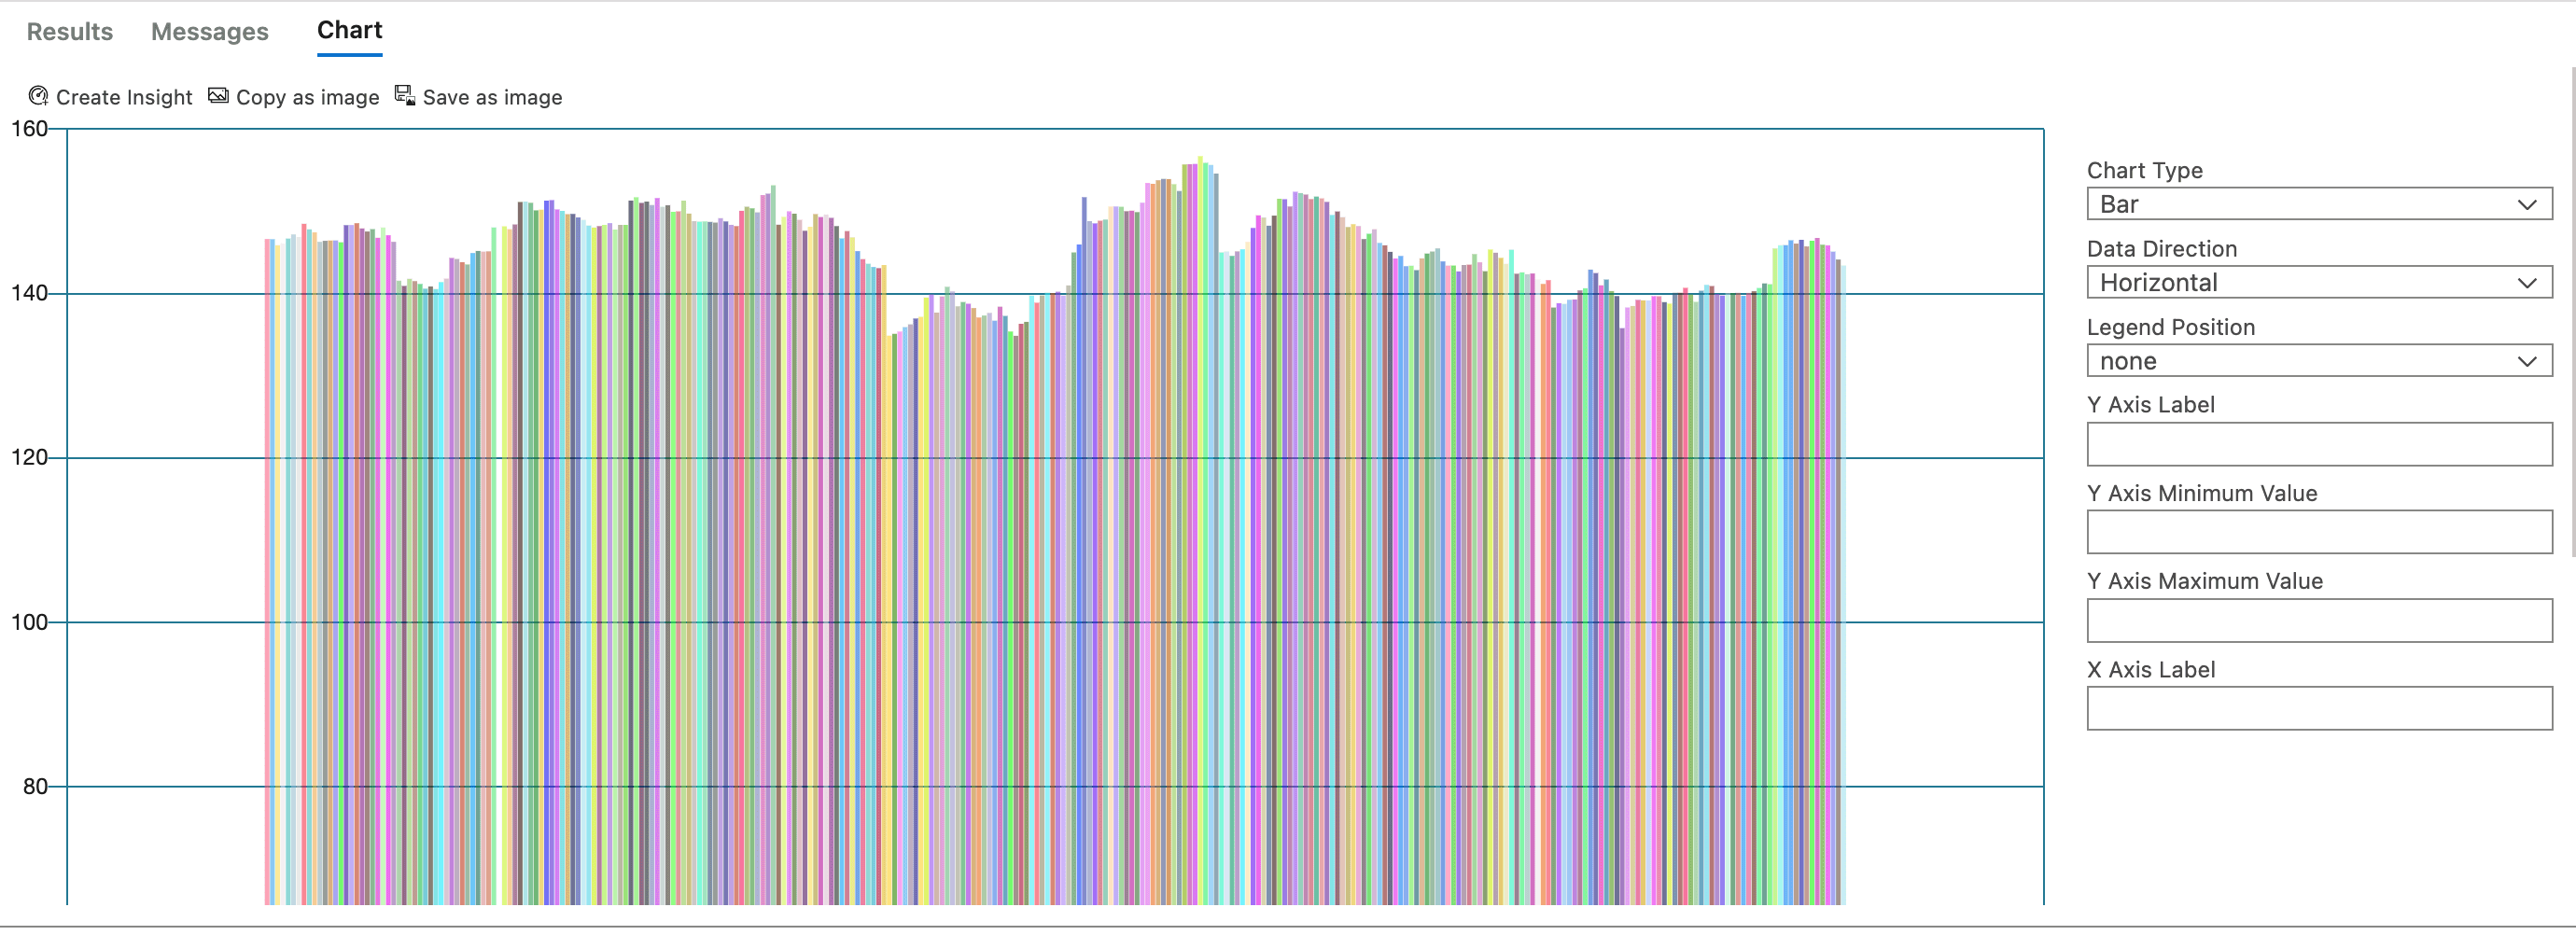
Data studio previews the data in a table form. To convert it into a visual,
click Chart from the sidebar and select Chart Type as Bar. The data can be
saved in CSV, XML, JSON, Excel formats or as an Image.
You can save the chart configuration and add it as a custom widget to display
data in a dashboard. To do that, click Create Insight under the Chart tab and
save the code displayed in a JSON format.
{
  "name": "Apple hourly price history",
  "gridItemConfig": {
    "sizex": 2,
    "sizey": 1
  },
  "widget": {
    "insights-widget": {
      "type": {
        "bar": {
          "dataDirection": "horizontal",
          "columnsAsLabels": true,
          "labelFirstColumn": false,
          "legendPosition": "none",
          "xAxisMin": "2022-12-05T17:41",
          "xAxisMax": "2022-12-06T17:41",
          "dataType": "point"
        }
      },
      "queryFile": "Users/<user>/applquery.sql"
    }
  }
}
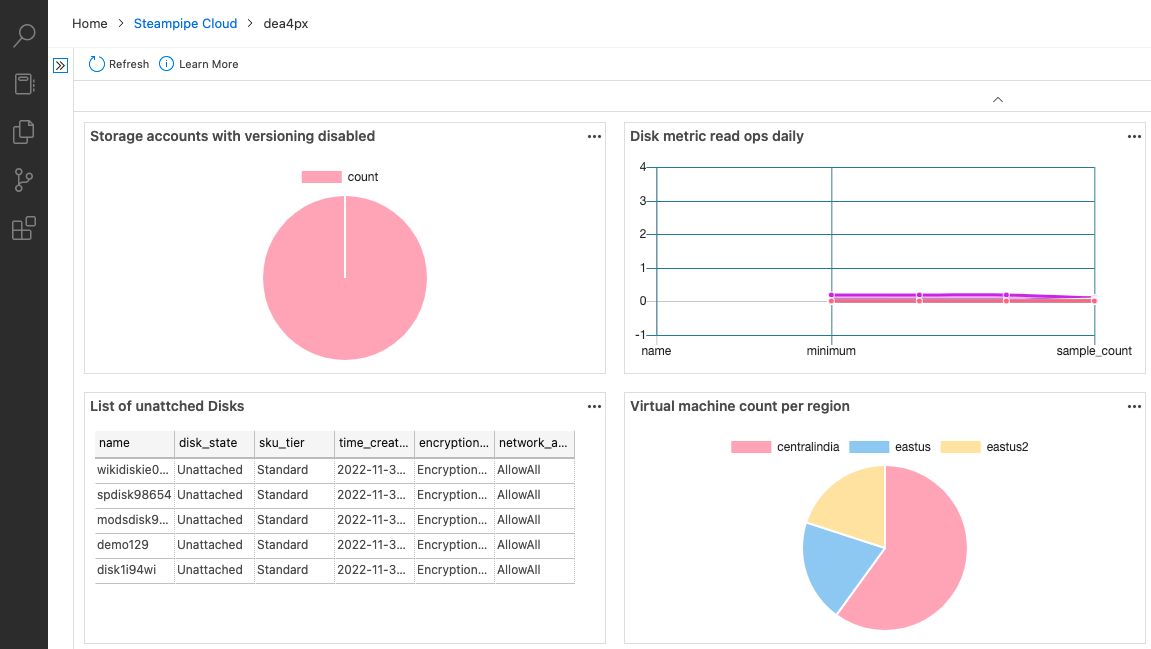
Create a dashboard to analyze Azure resources
The charts made with Insights widget are the building blocks of a dashboard.
Here we'll build a dashboard that monitors and analyzes Azure resources. To
begin, create charts with these four queries using Doughnut for Storage
accounts with versioning disabled, Line for Disk metric read ops daily,
Table for List of unattached disks and Pie for Virtual machine count per
region. Then, click Create Insight to save their JSON configurations.
Storage accounts with versioning disabled
select
  count(name)
from
  azure_storage_account
where
  not blob_versioning_enabled;
Disk metric read ops daily
select
  name,
  timestamp,
  minimum,
  maximum,
  average,
  sample_count
from
  azure_compute_disk_metric_read_ops_daily
order by
  timestamp;
List of unattached disks
select
  name,
  disk_state,
  sku_tier,
  time_created,
  encryption_type,
  network_access_policy
from
  azure_compute_disk
where
  disk_state = 'Unattached';
Virtual machine count per region
select
  region,
  count(name)
from
  azure_compute_virtual_machine
group by
  region;
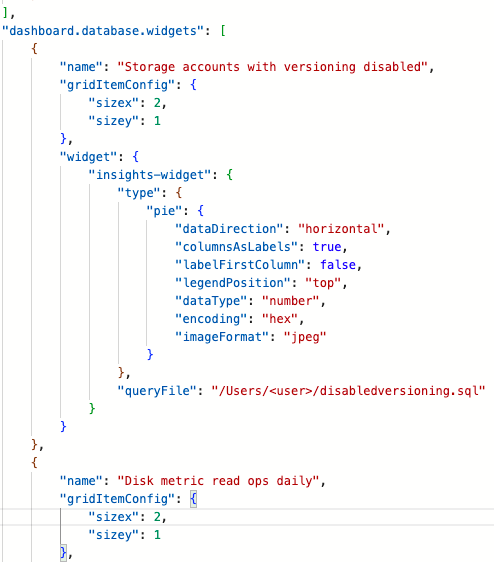
To build, open Dashboard under Preferences: Open User Settings and click
Edit in settings.json for Dashboard > Database: Widgets. Paste the insight
JSON configuration for the visuals under dashboard.database.widgets. To note
here, Data Studio requires the queries to be saved in a .sql file with the
queryFile: configuration property pointing at its path.
Save the user settings and right-click on the database name and select Manage
to display the Dashboard.
Summary
With Azure Data Studio and Turbot Pipes you can:
-
View tables in your Turbot Pipes workspace
-
Write custom queries to preview data from the tables in your Turbot Pipes workspace
-
Create insight widgets for dashboards driven by your custom queries