Connect to Turbot Pipes from Metabase
Connect to Turbot Pipes from Metabase
Metabase is an open source tool that connects to many databases, including Postgres, and enables users to explore, query, and visualize data.
Steampipe provides a single interface to all your cloud, code, logs and more. Because it's built on Postgres, Steampipe provides an endpoint that any Postgres-compatible client -- including Metabase -- can connect to.
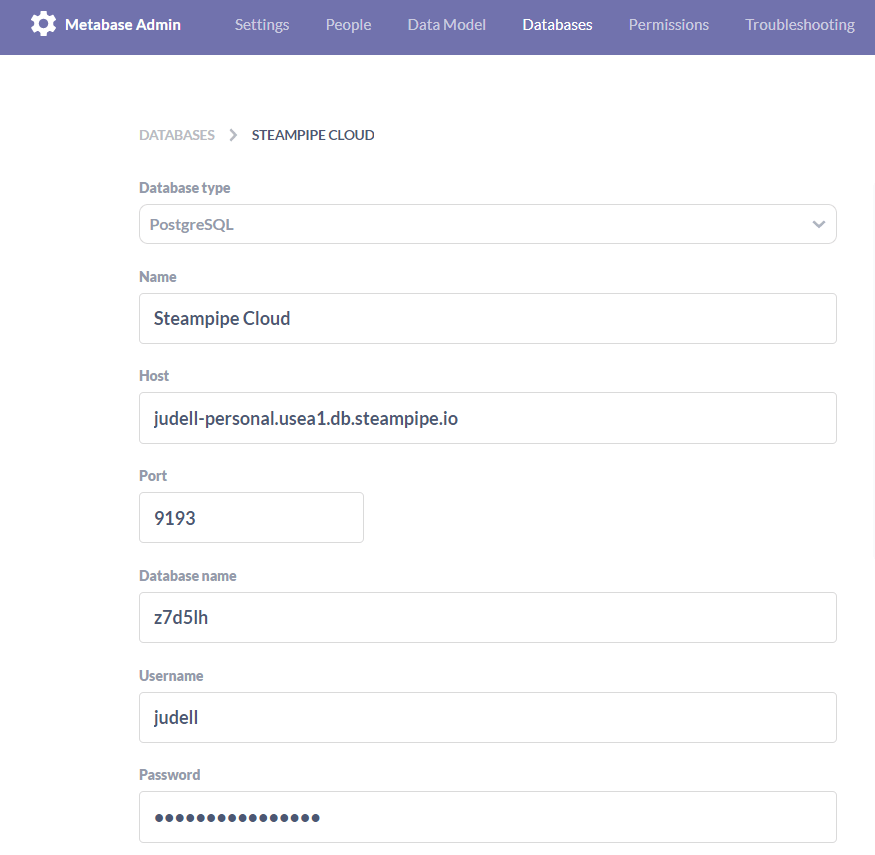
You can get the information needed to connect to your Turbot Pipes database instance from the Developers tab on the Steampipe page for your workspace.

Connect to Steampipe CLI from Metabase
You can also connect Metabase to
Steampipe CLI. To do that, run
steampipe service start --show-password and use the displayed connection
details.
Steampipe service is running:

Database:

  Host(s):            localhost, 127.0.0.1, 172.28.158.171
  Port:               9193
  Database:           steampipe
  User:               steampipe
  Password:           9a**-****-**7e
  Connection string:  postgres://steampipe:9a**-****-**7e@localhost:9193/steampipe
Getting started
Metabase is a JVM app that you can run as a JAR file, or in a container, or as a native Mac app.
Here's one way to launch Metabase.
docker run -d -p 3000:3000 --name metabase metabase/metabase
With Metabase up and running, point a browser at port 3000, select Postgres as
the database type, and enter your Turbot Pipes connection info.
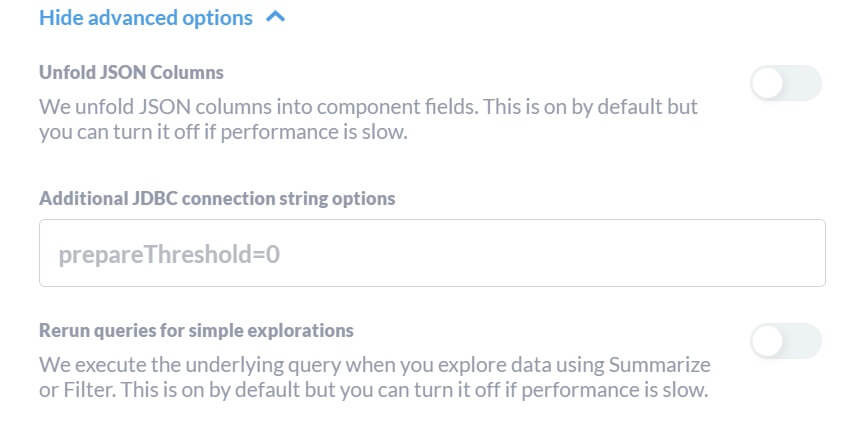
Under Advanced Options, turn off both Unfold JSON Columns and
Rerun queries for simple explorations.
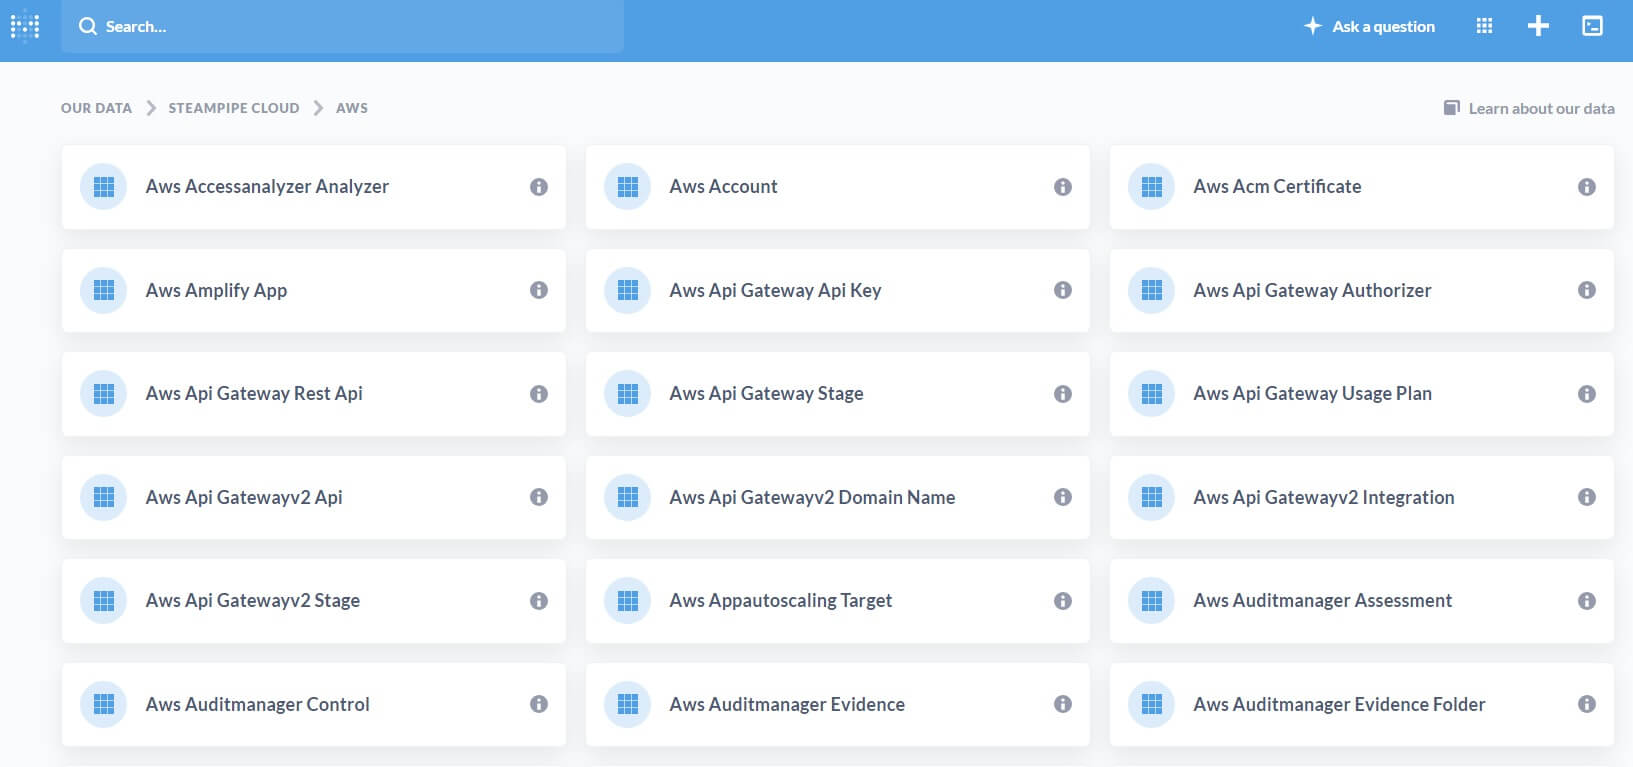
Then browse to the Turbot Pipes database where you'll see a card for each installed plugin. Note that even with those two options off, it will take some time for Metabase to do its initial sync, especially for a plugin like AWS plugin that provides hundreds of tables.

Each card opens a view of the tables provided by a plugin. Here's the first
screenful of tables provided by the aws plugin.
Summarize, filter, and chart one AWS table
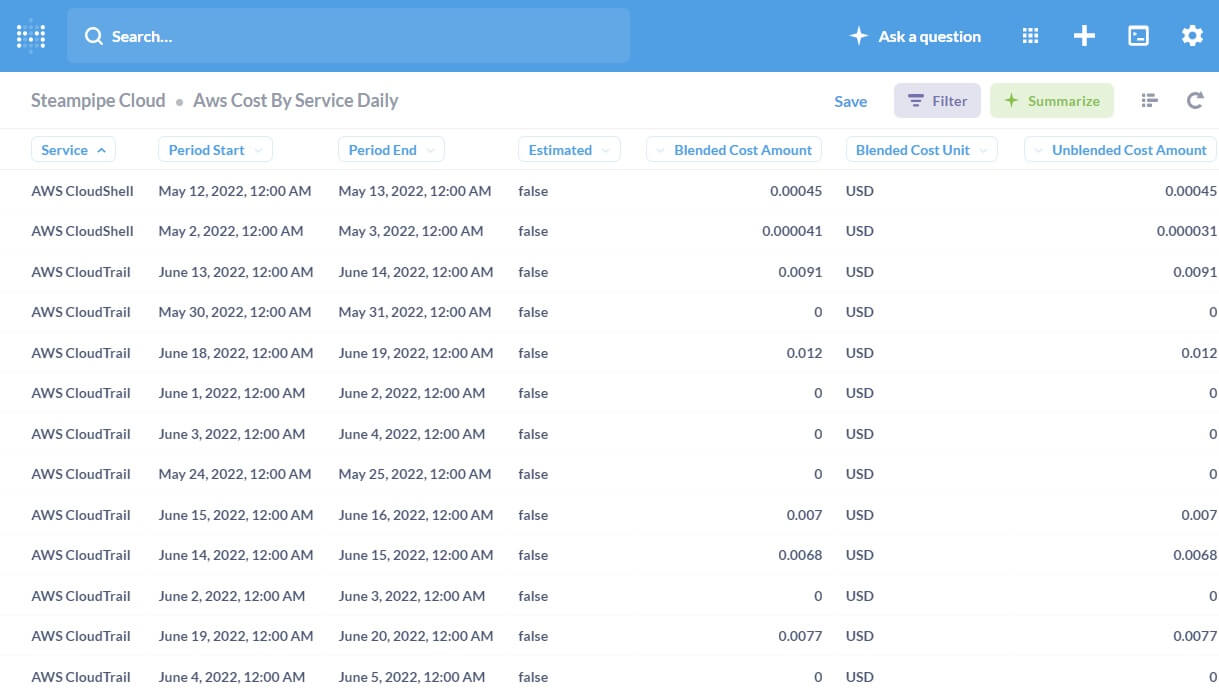
We'll focus here on the
aws_cost_by_service_daily
table. Metabase displays an initial view of the data, with buttons to Filter
and Summarize.
Click Summarize, choose Sum of ..., and pick Blended Cost Amount. Under
Group by choose Period Start. Metabase charts the total costs for all
services. The default grouping is weekly but you can switch to daily or monthly.
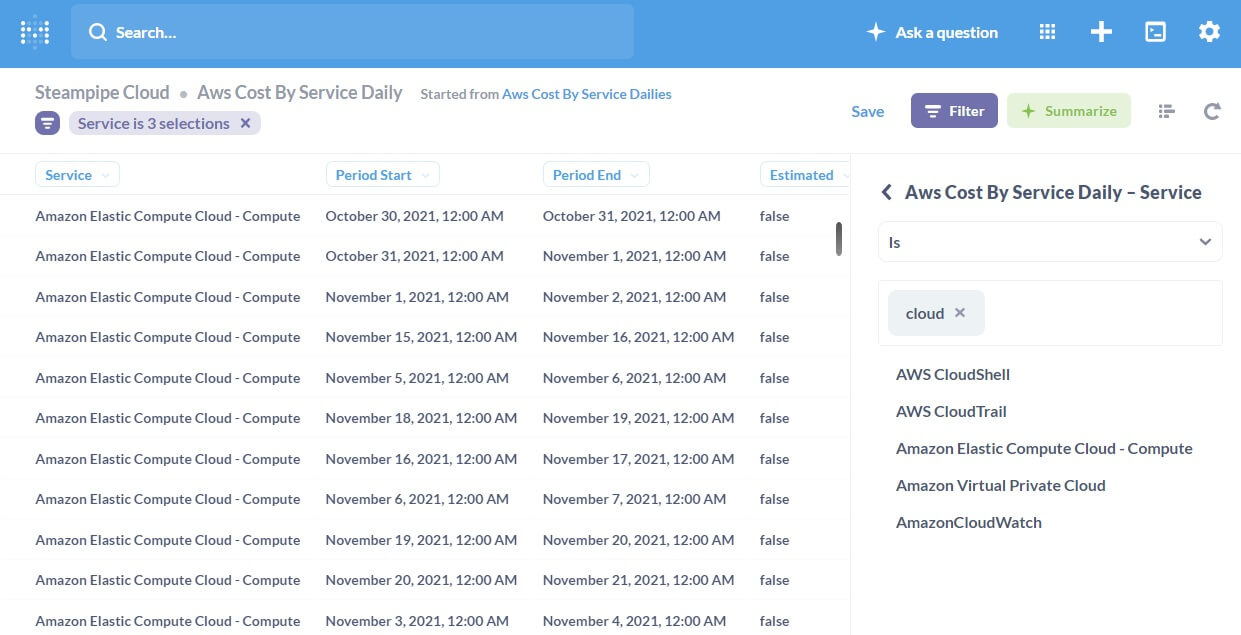
To summarize by the names of AWS services, open the Admin → Data Model screen,
navigate to the aws_cost_by_service_daily table, and change the type of the
Service column from No semantic type to Category. Then revisit the
Filter operation on the table and choose Service. Now you can search for one
or more services and filter the view to just those services.
These interactive methods are handy, but you can also open a SQL editor (click
Ask a question → Native query) and write queries just as you do in Turbot
Pipes, with some extra features provided by Metabase.
Use Metabase-enhanced SQL
You can augment your SQL queries with Metabase idioms that parameterize queries
and connect them to a suite of UX widgets. To try that, click
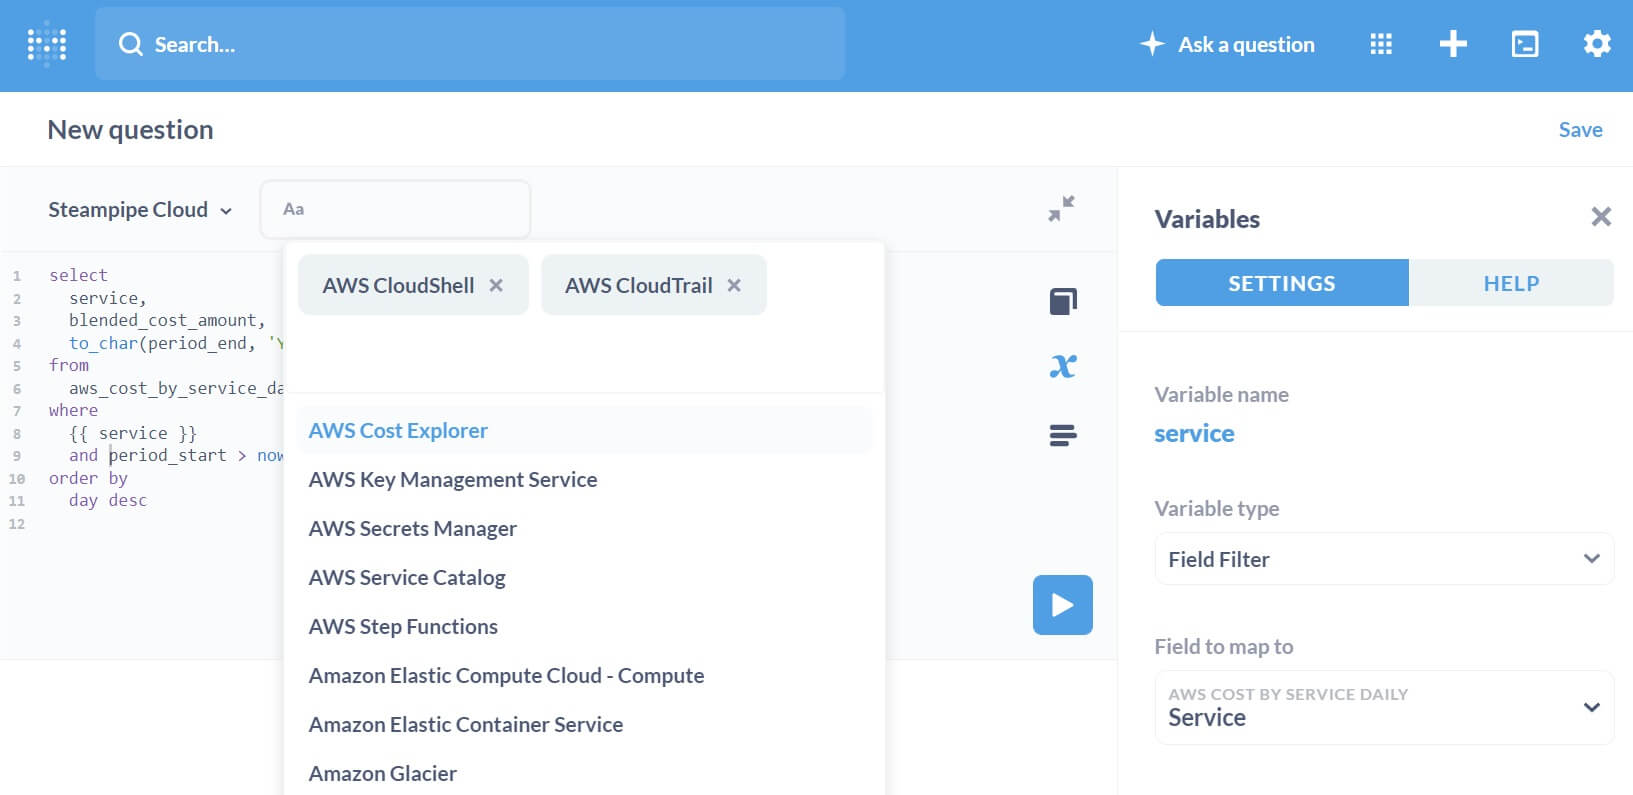
Ask a question → Native query → Turbot Pipes and paste this SQL.
select
  service,
  blended_cost_amount,
  to_char(period_end, 'YYYY-MM-DD') as day
from
  aws_cost_by_service_daily
where
  {{ service }}
  and period_start > now() - interval '1 month'
order by
  day desc
When it sees a name in double squigglies, Metabase opens its Variables pane.
Choose Field Filter as the type. To pick a field to map to, navigate from the
list of schemas (all the installed plugins) to Aws to
Aws Cost By Service Daily and choose Service. Now you can use a picker to
filter the view to one or more services, as above.
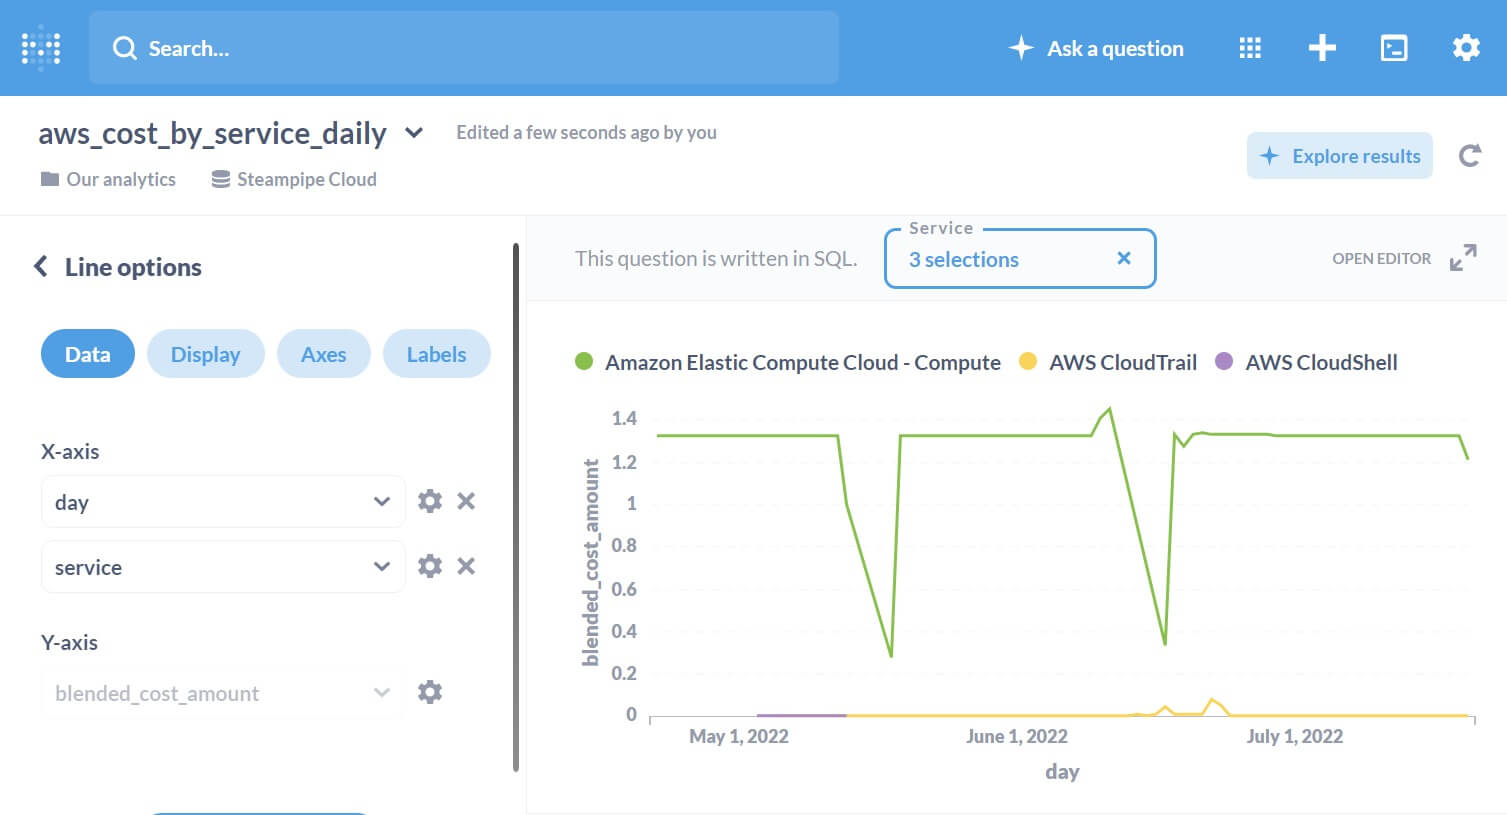
To chart the data, click Visualization. Here's a chart for a selection of 3
services.
Send alerts
Suppose you'd like to be notified when the daily blended cost of any service exceeds 10 dollars. Here's a query to find those rows in the table.
select
  service,
  to_char(period_end, 'MM-DD') as day,
  period_end,
  blended_cost_amount
from
  aws_cost_by_service_daily
where
  blended_cost_amount > 10
  and period_start > now()::timestamptz - interval '2 day'
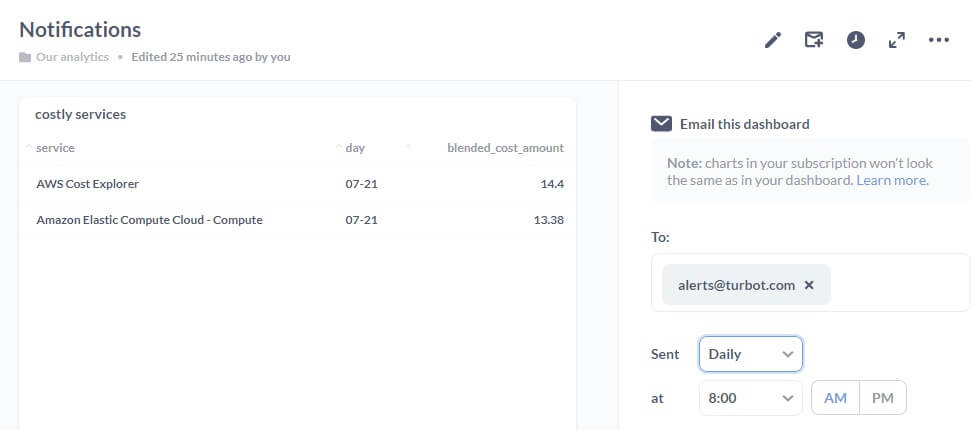
In order to send an alert when one or more rows exceeds the threshold, first
save the query as a Metabase question: a URL-addressable view like
HOST://question/1-costly-services. Then create a Metabase dashboard, which
is a container for one or more Metabase queries, and add the question to the
dashboard.
Using a Metabase feature called Dashboard Subscriptions, you can can then set up notifications using email or Slack. Metabase will only notify when a table on the subscribed dashboard produces rows.
Summary
With Metabase and Turbot Pipes you can:
-
Summarize, filter, and chart the tables in your Turbot Pipes workspace
-
Create interactive widgets driven by data in those tables
-
Send query-driven alerts