Connect to Turbot Pipes from Power BI
Connect to Turbot Pipes from Power BI
Power BI is a business intelligence tool for data exploration and visualization that connects to many databases, including Postgres, and enables users to explore, query, and visualize data.
Steampipe provides a single interface to all your cloud, code, logs and more. Because it's built on Postgres, Steampipe provides an endpoint that any Postgres-compatible client -- including Power BI -- can connect to.
You can get the information needed to connect to your Turbot Pipes database instance from the Developers tab on the Steampipe page for your workspace.

Connect to Steampipe CLI from Power BI
You can also connect Power BI to
Steampipe CLI. To do that, run
steampipe service start --show-password and use the displayed connection
details.
Steampipe service is running:

Database:

  Host(s):            localhost, 127.0.0.1, 192.168.29.204
  Port:               9193
  Database:           steampipe
  User:               steampipe
  Password:           99**_****_**8c
  Connection string:  postgres://steampipe:99**_****_**8c@localhost:9193/steampipe
Getting started
Power BI is available for Windows. Here we will create a Turbot Pipes connection from Power BI.
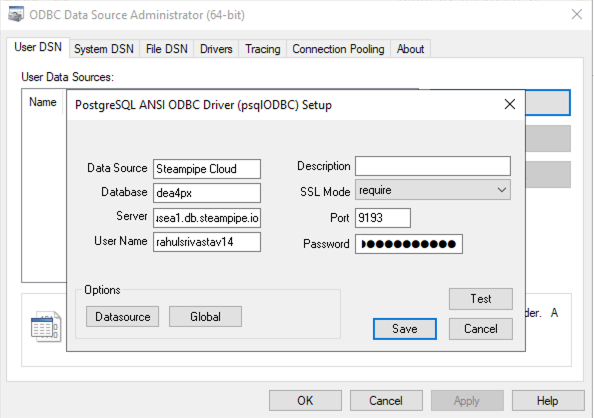
To create a new connection, first install the
PostgreSQL ODBC driver. (Remote
databases are not accessible with the built-in data source support.) Enter the
Turbot Pipes connection details, set the SSL Mode to require and click Test to
Verify then click Save.
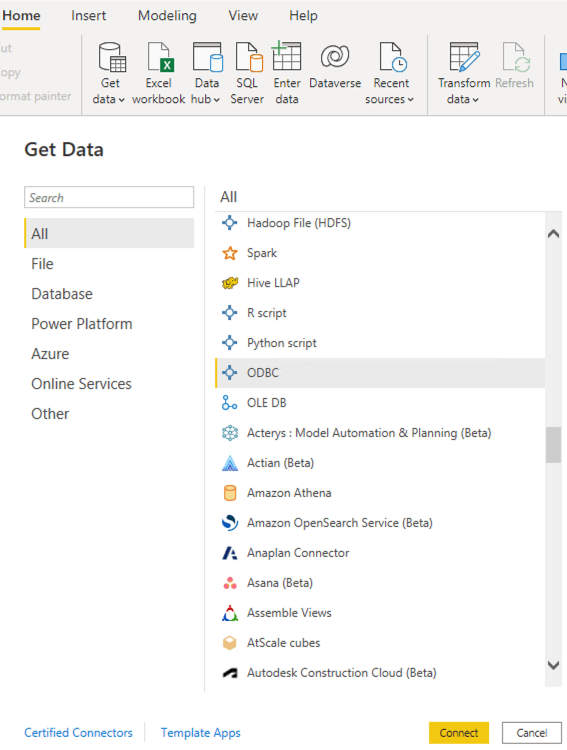
To connect the database to Power BI, click Get data from the ribbon, select
ODBC, and connect to the data source.
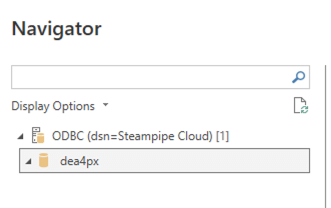
Once the data source is connected, select and load the database from the navigator.
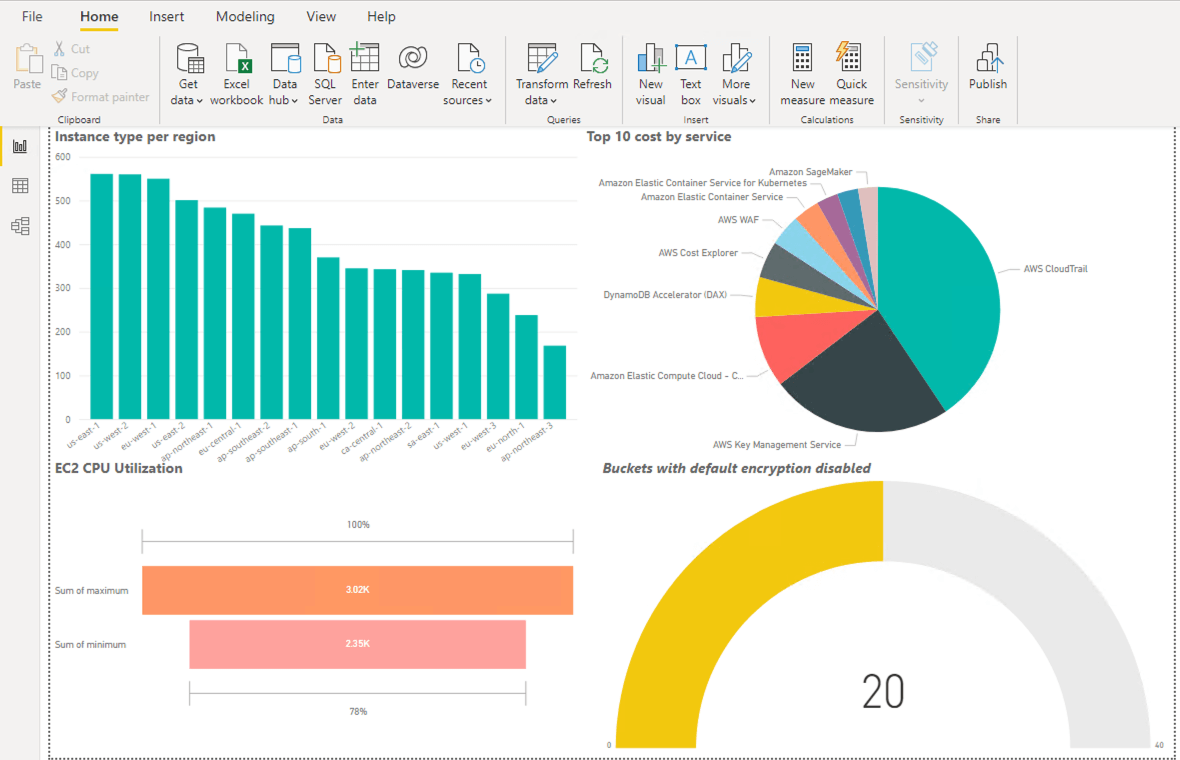
Create a report dashboard to analyze resources
We'll focus here on creating a dashboard to monitor and analyze AWS services. To
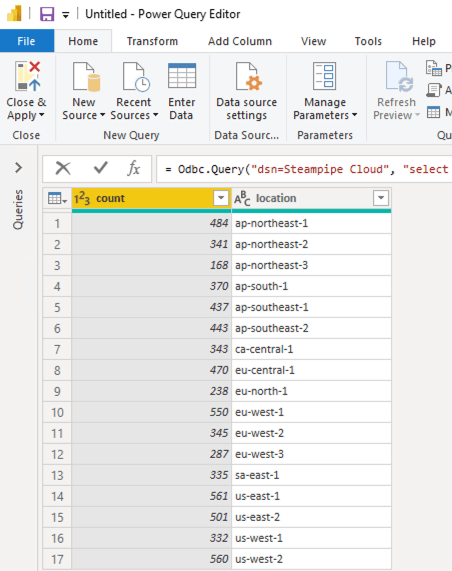
begin, click Transform data from the ribbon to open the Power Query editor,
then add the data source either by clicking on New Source or by selecting it
from under Recent Sources. Since tables from the plugins are not listed, we
will create a visual
for instance types per region that uses this query.
= Odbc.Query("dsn=<data source name>", "select
  count(instance_type),
  location
from
  aws_ec2_instance_availability
group by location")
Once Power BI previews the data, click on Close & Apply to save. You may also
save it into a CSV file using the export option.
Now click New Visual from the ribbon and create visuals for CPU utilization,
buckets with default encryption disabled, and top 10 cost by service with these
queries.
= Odbc.Query("dsn=<data source name>", "select
  instance_id,
  timestamp,
  minimum,
  maximum,
  average,
  sample_count
from
  aws_ec2_instance_metric_cpu_utilization
order by
  instance_id,
  timestamp;")
= Odbc.Query("dsn=<data source name>", "select
  count(name)
from
  aws_s3_bucket
where
  server_side_encryption_configuration is null;")
= Odbc.Query("dsn=<data source name>", "select
  service,
  sum(unblended_cost_amount)::numeric::money as sum,
  avg(unblended_cost_amount)::numeric::money as average
from
  aws_cost_by_service_monthly
group by
  service
order by
  average desc
limit 10;")
Power BI provides a variety of visuals under the Visualizations tab. Here we use
Stacked column chart for instance types per region, Funnel for CPU
utilization, Gauge to show buckets with default encryption disabled, and
Pie chart to show top 10 cost by service. The dashboard can also be downloaded
as a PDF file to be shared by simply using Export to PDF from the Export
option under the file menu.
Summary
With Power BI and Turbot Pipes you can:
-
Write custom queries to preview data from the tables in your Turbot Pipes workspace
-
Create interactive dashboards driven by your custom queries
-
Export and share dashboards