Connect to Turbot Pipes from Sigma
Connect to Turbot Pipes from Sigma
Sigma is a cloud-native analytics platform with a user-friendly spreadsheet interface for instant, code-free exploration and real-time insights from cloud data warehouses.
Steampipe provides a single interface to all your cloud, code, logs and more. Because it's built on Postgres, Steampipe provides an endpoint that any Postgres-compatible client — including Sigma — can connect to.
You can get the information needed to connect to your Turbot Pipes database instance from the Developers tab on the Steampipe page for your workspace.

Once the connection to Turbot Pipes is established, you can access the tables provided by the Steampipe plugins, run queries, and build reports.
You can also connect Sigma to Steampipe CLI. To do that, run steampipe service start --show-password and use the displayed connection details.
Steampipe service is running:

Database:

  Host(s):            localhost, 127.0.0.1, 192.168.29.204
  Port:               9193
  Database:           steampipe
  User:               steampipe
  Password:           99**_****_**8c
  Connection string:  postgres://steampipe:99**_****_**8c@localhost:9193/steampipe
Getting started
Sigma is available as a free trial or by making a paid purchase.
To create a new connection click on the profile icon located at the top right corner and click on Add connection, name your connection and select PostgreSQL. Then add the connection details and click Create.
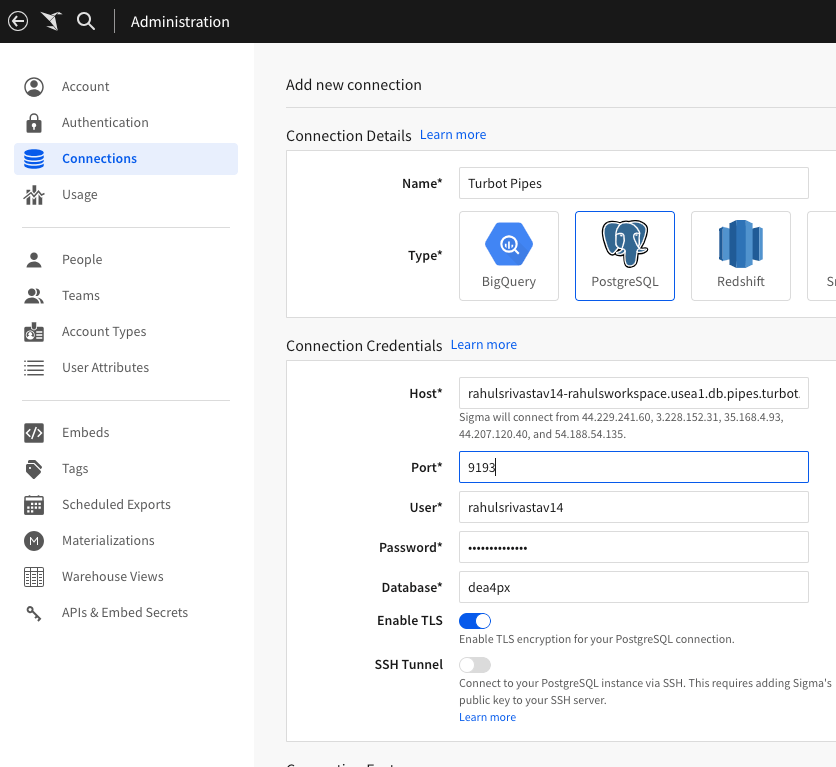
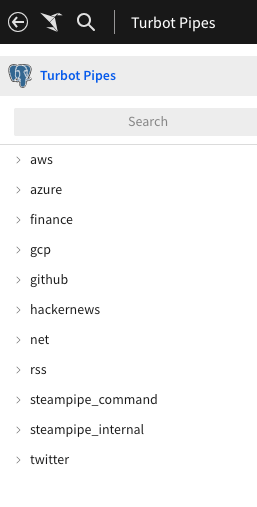
Once you've connected to Turbot Pipes, you can access plugins and their tables from the object explorer.
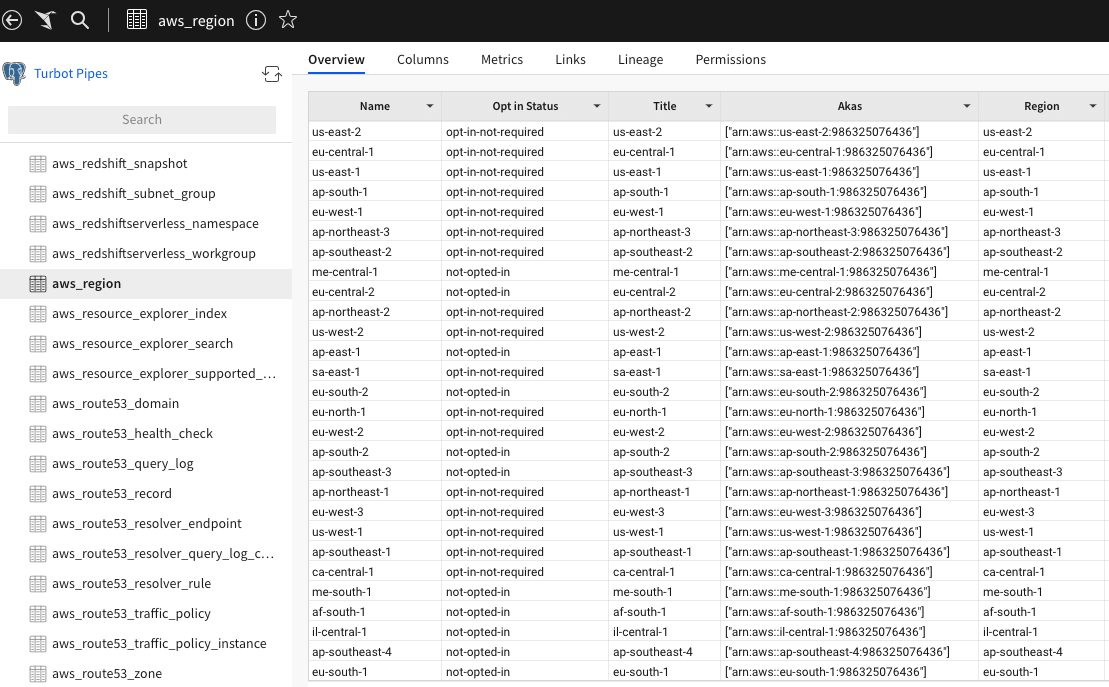
Here we select the aws_region table from the `AWS Plugin. Sigma displays the table's schema and previews the returned data which can be exported into various formats.
Create and share a chart with custom query
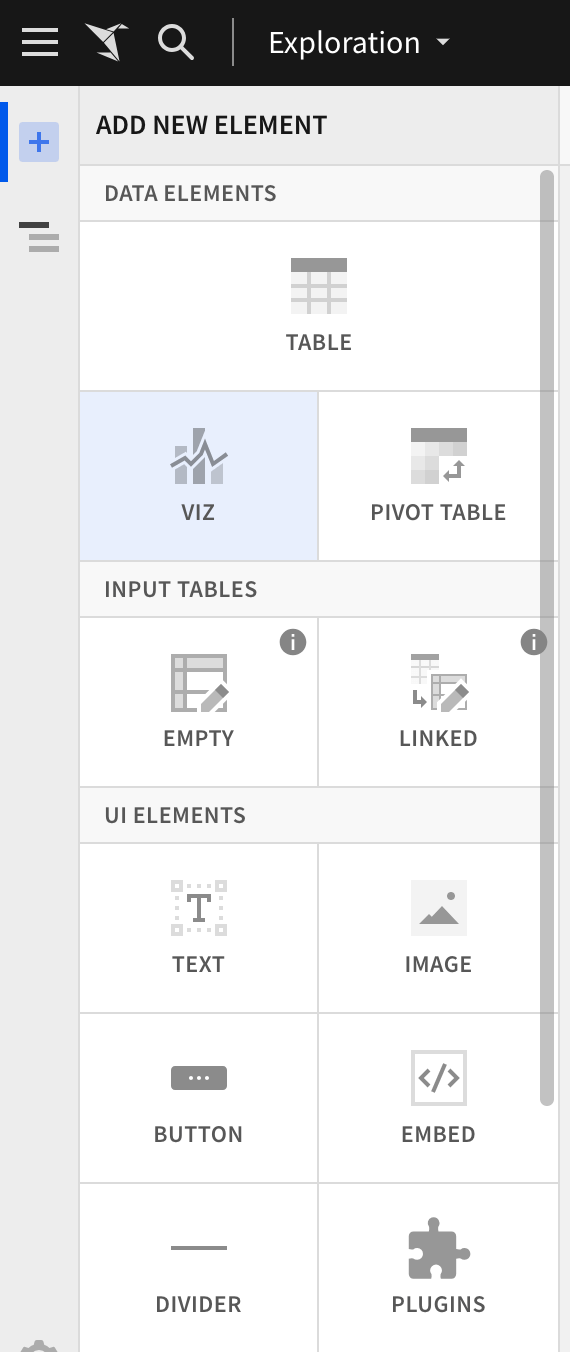
Here we will focus on creating a chart to analyze the S3 buckets that restrict public bucket policies. To begin, click Create New then click Workbook. Select VIZ under Data Elements, then select Write SQL.
Paste this query in the command palette, then click Run.
select
  name,
  region,
  account_id,
  restrict_public_buckets
from
  aws_s3_bucket
Sigma previews the data in the table form. Now click Save to open the visualization data form and select Type as Pie. Update the Value field with Name and Restrict Public Buckets to generate the chart with the data.

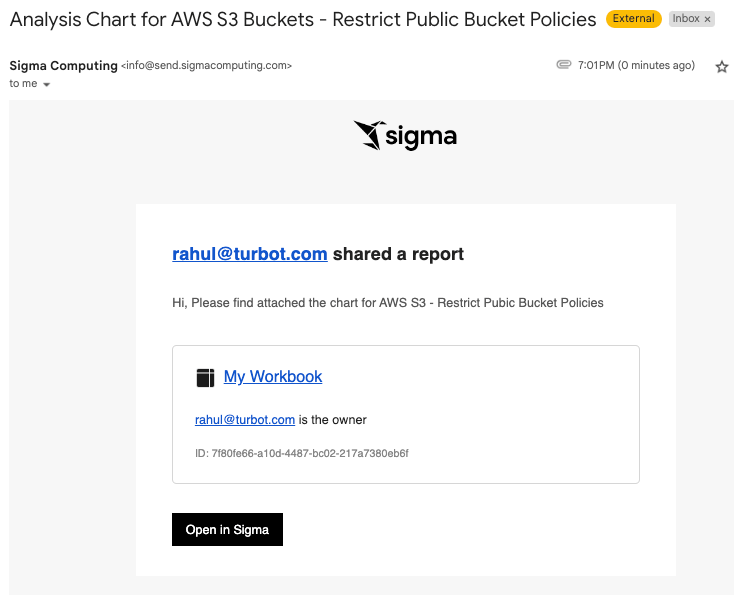
The generated charts can be distributed via email, Slack, or uploaded to cloud storage using the export menu. Here, the created chart has been shared via email.
Summary
With Sigma and Turbot Pipes you can:
View tables in your Turbot Pipes workspace
Write custom queries to preview data from the tables in your Turbot Pipes workspace and create charts driven by them
Share the generated charts