Connect to Turbot pipes from Navicat
Connect to Turbot pipes from Navicat
Navicat is a database management and design tool. It connects to many databases, including Postgres, and enables users to explore, query, and visualize data.
Steampipe provides a single interface to all your cloud, code, logs and more. Because it's built on Postgres, Steampipe provides an endpoint that any Postgres-compatible client -- including Navicat -- can connect to.
You can get the information needed to connect to your Turbot Pipes database instance from the Developers tab on the Steampipe page for your workspace.

Connect to Steampipe CLI from Navicat
You can also connect Navicat to Steampipe CLI. To do that, run steampipe service start --show-password and use the displayed connection details.
Steampipe service is running:

Database:

  Host(s):            localhost, 127.0.0.1, 192.168.29.204
  Port:               9193
  Database:           steampipe
  User:               steampipe
  Password:           99**_****_**8c
  Connection string:  postgres://steampipe:99**_****_**8c@localhost:9193/steampipe
Getting started
Navicat is available to use on your desktop through a free trial or by making a paid purchase.
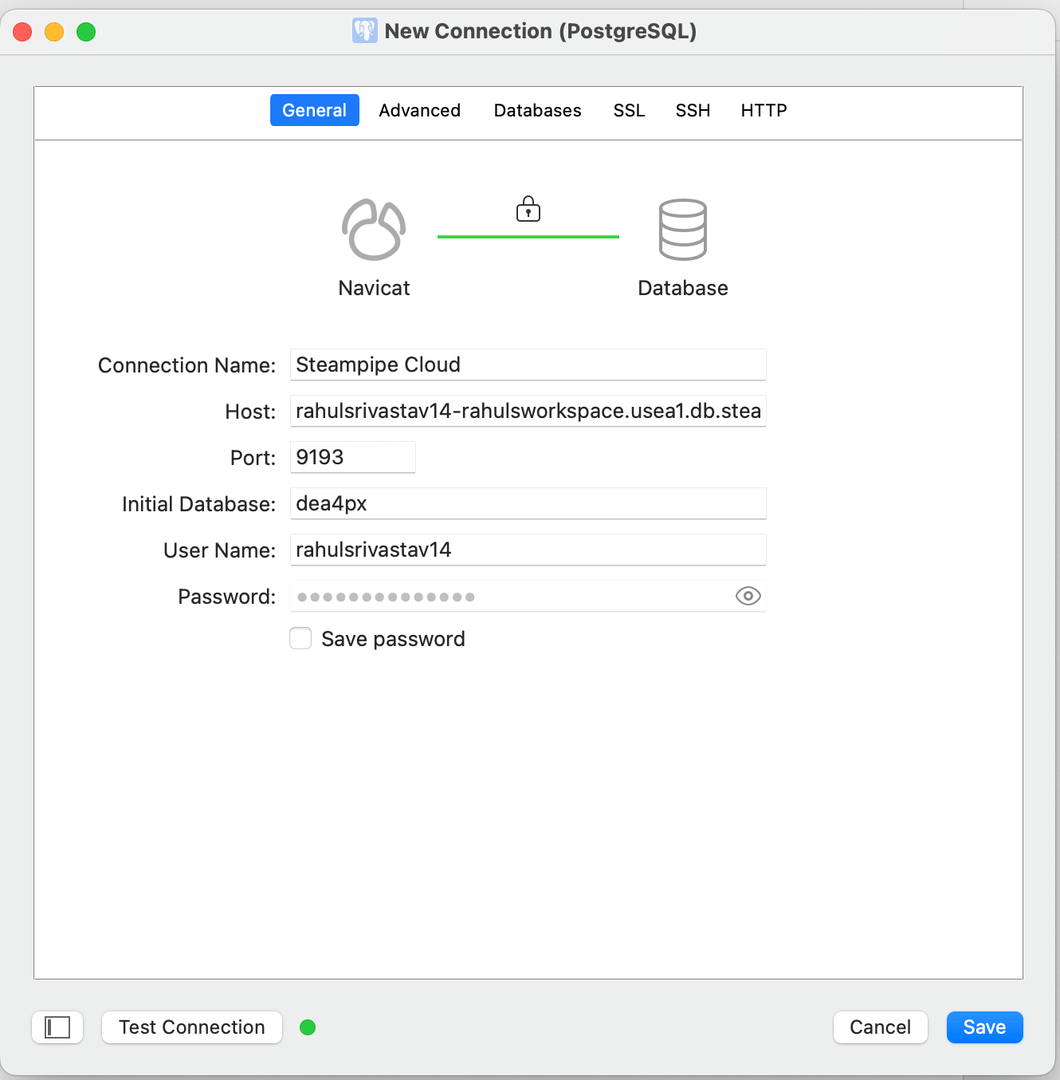
To create a new connection, first click on Connection and select PostgreSQL. Enter the connection details, enable SSL,click Test Connection to verify, then click Save.

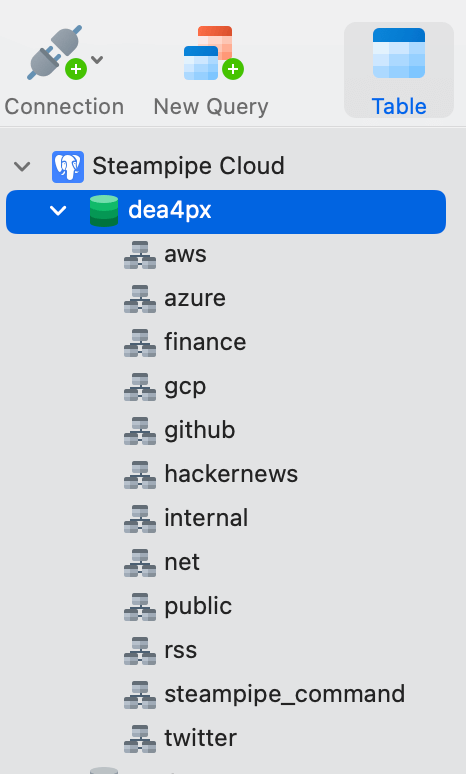
Once you're connected to Turbot pipes, the PostgreSQL Explorer can access the connection's tables in your workspace.

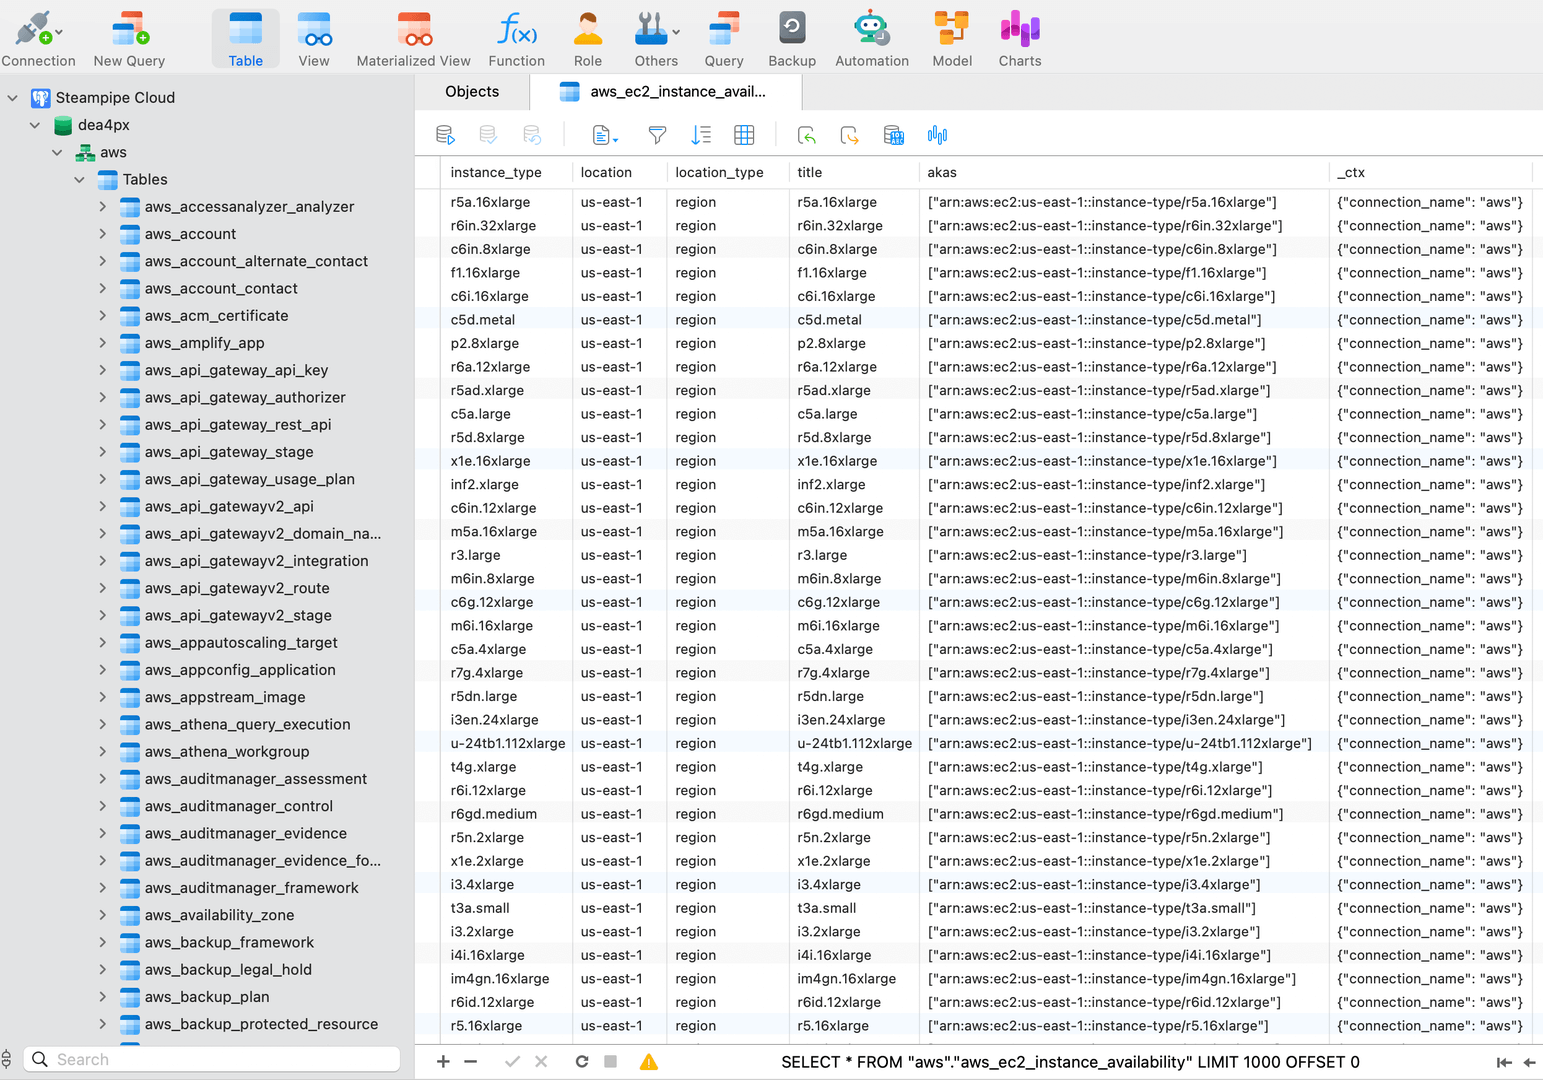
We use the AWS plugin and select the aws_ec2_instance_availability table. Navicat displays the table's schema and previews the data. You can drag the columns to organize the data, and export the data to a variety of formats.

Create a chart with custom query
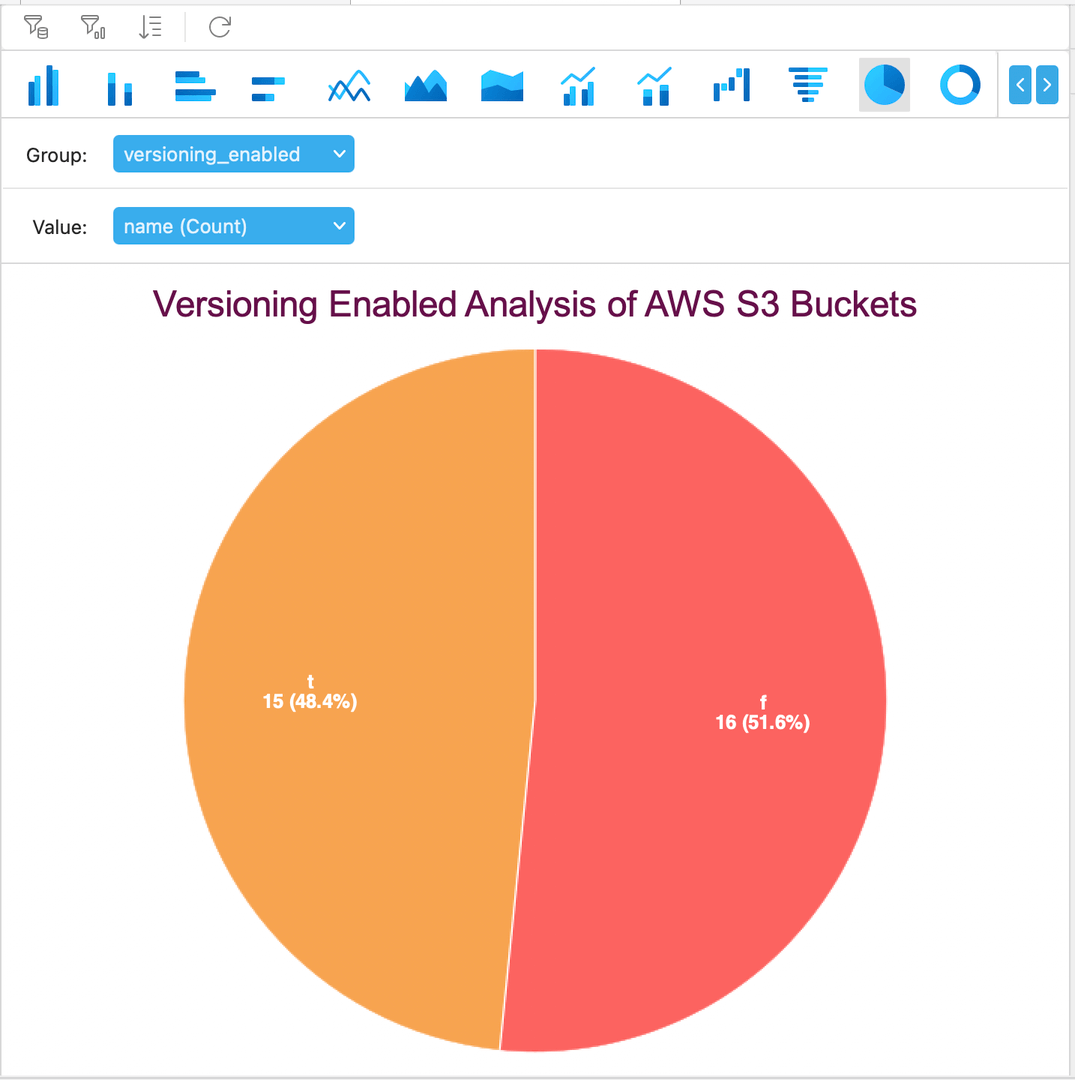
Here we will focus on creating a chart to analyze the versioning status of S3 Buckets in the AWS account. To begin, click the New Query block, paste this query in the command palette, then click Run.
select
  name,
  region,
  account_id,
  versioning_enabled
from
  aws_s3_bucket
Navicat then previews the data in a table form. Now click on the Create Chart icon to open the visualize data form and select Type as Pie chart. Update the Group field with versioning_enabled and Value with name to display the chart with the data.

Summary
With Navicat and Turbot pipes you can:
View tables in your Turbot pipes workspace
Write custom queries to preview data from the tables in your Turbot pipes workspace
Create charts driven by your custom queries