Usage
Usage
Pipes provides Usage information to help you view and understand your workspace usage, including used storage and compute time for all workspaces in your developer account.
Because Pipes is billed based on your usage, understanding usage is an essential aspect of managing and optimizing your resources effectively. By monitoring these metrics, you can ensure that your workspaces operate efficiently and meet your needs in a cost-effective manner.
Usage
To view summary usage for your developer account, go to the Advanced page for your account and click Usage from the left-hand menu.
The Usage page provides visibility into your account's computing and storage usage. At the top of the page, you can see your estimated month-to-date charges and compute usage, as well as a summary of your usage thresholds. Note that the usage thresholds can only be managed at the billable entity; if your developer account is part of a tenant you must manage the usage thresholds on the tenant.

The Daily Usage provides a summary of your usage for the last full day, including the total storage across all workspaces and the total compute minutes for the current day.

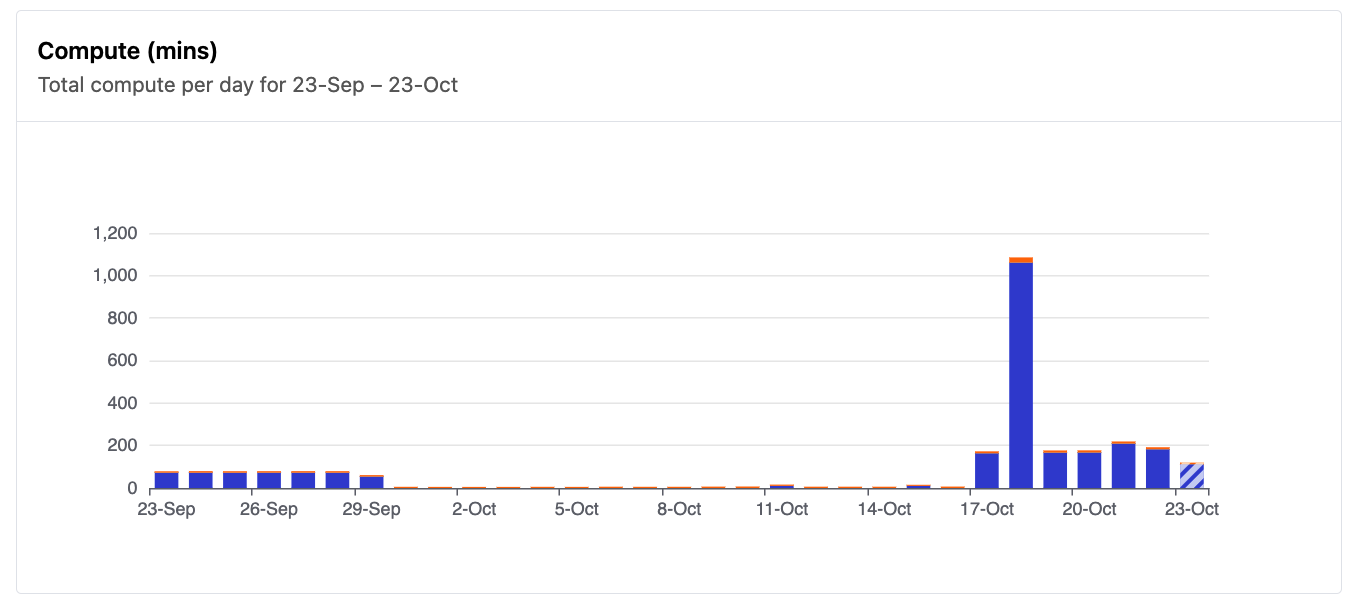
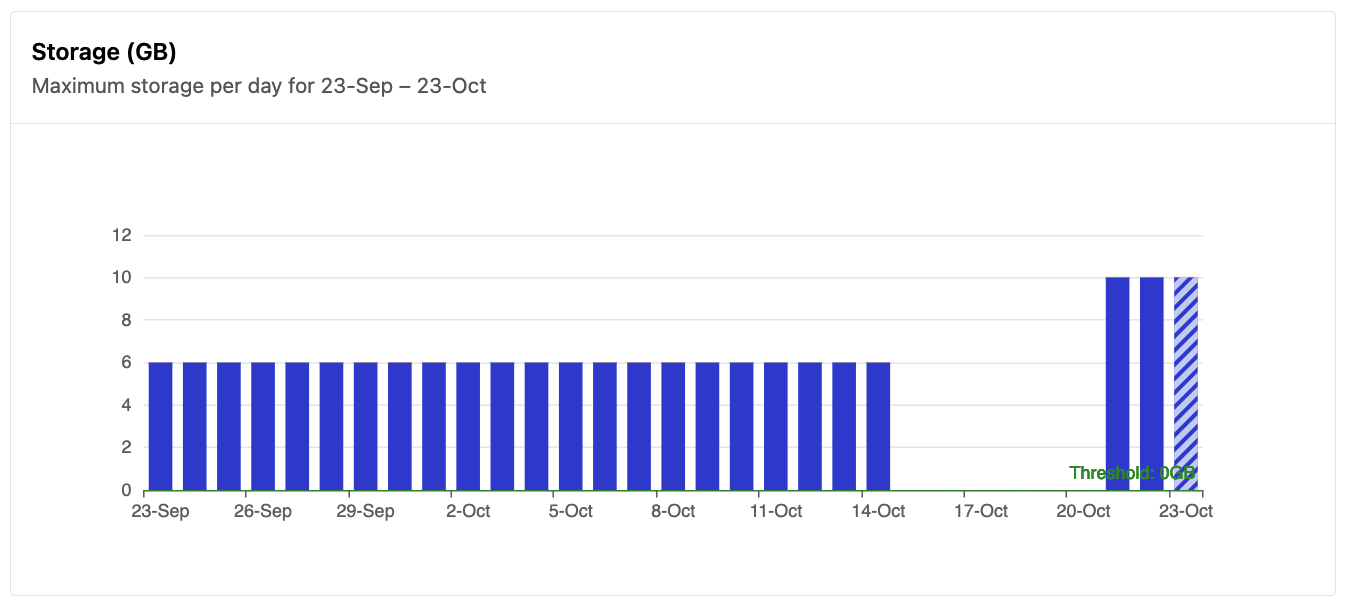
Charts for the compute and storage usage dimension appear below. You can select the date range for these charts. By default, the Last 30 days is shown, but you may instead select a different date range. The dashed line on each chart represents the included capacity for that metric in your plan. Hover over any bar in a chart to see the usage breakdown for that day.

The Compute (mins) chart shows you your cumulative compute usage as well as your compute usage for each day in the specified date range, broken down by type:
- Database Compute includes time spent running all workspace database instances. This includes any time spent running queries, as well as the 5-minute idle timeout.
- Process Compute includes time running all pipeline processes such as scheduled snapshots, Flowpipe pipelines & triggers, and Datatank updates.

The Storage (GB) chart details your total in-use storage capacity per day, broken down by type:
- Database Storage represents the sum of the size of all workspace database volumes.
- Process Logs is the sum of all process logs for all workspaces.
- Snapshot Storage is the sum of all snapshots for all workspaces.
Usage Thresholds
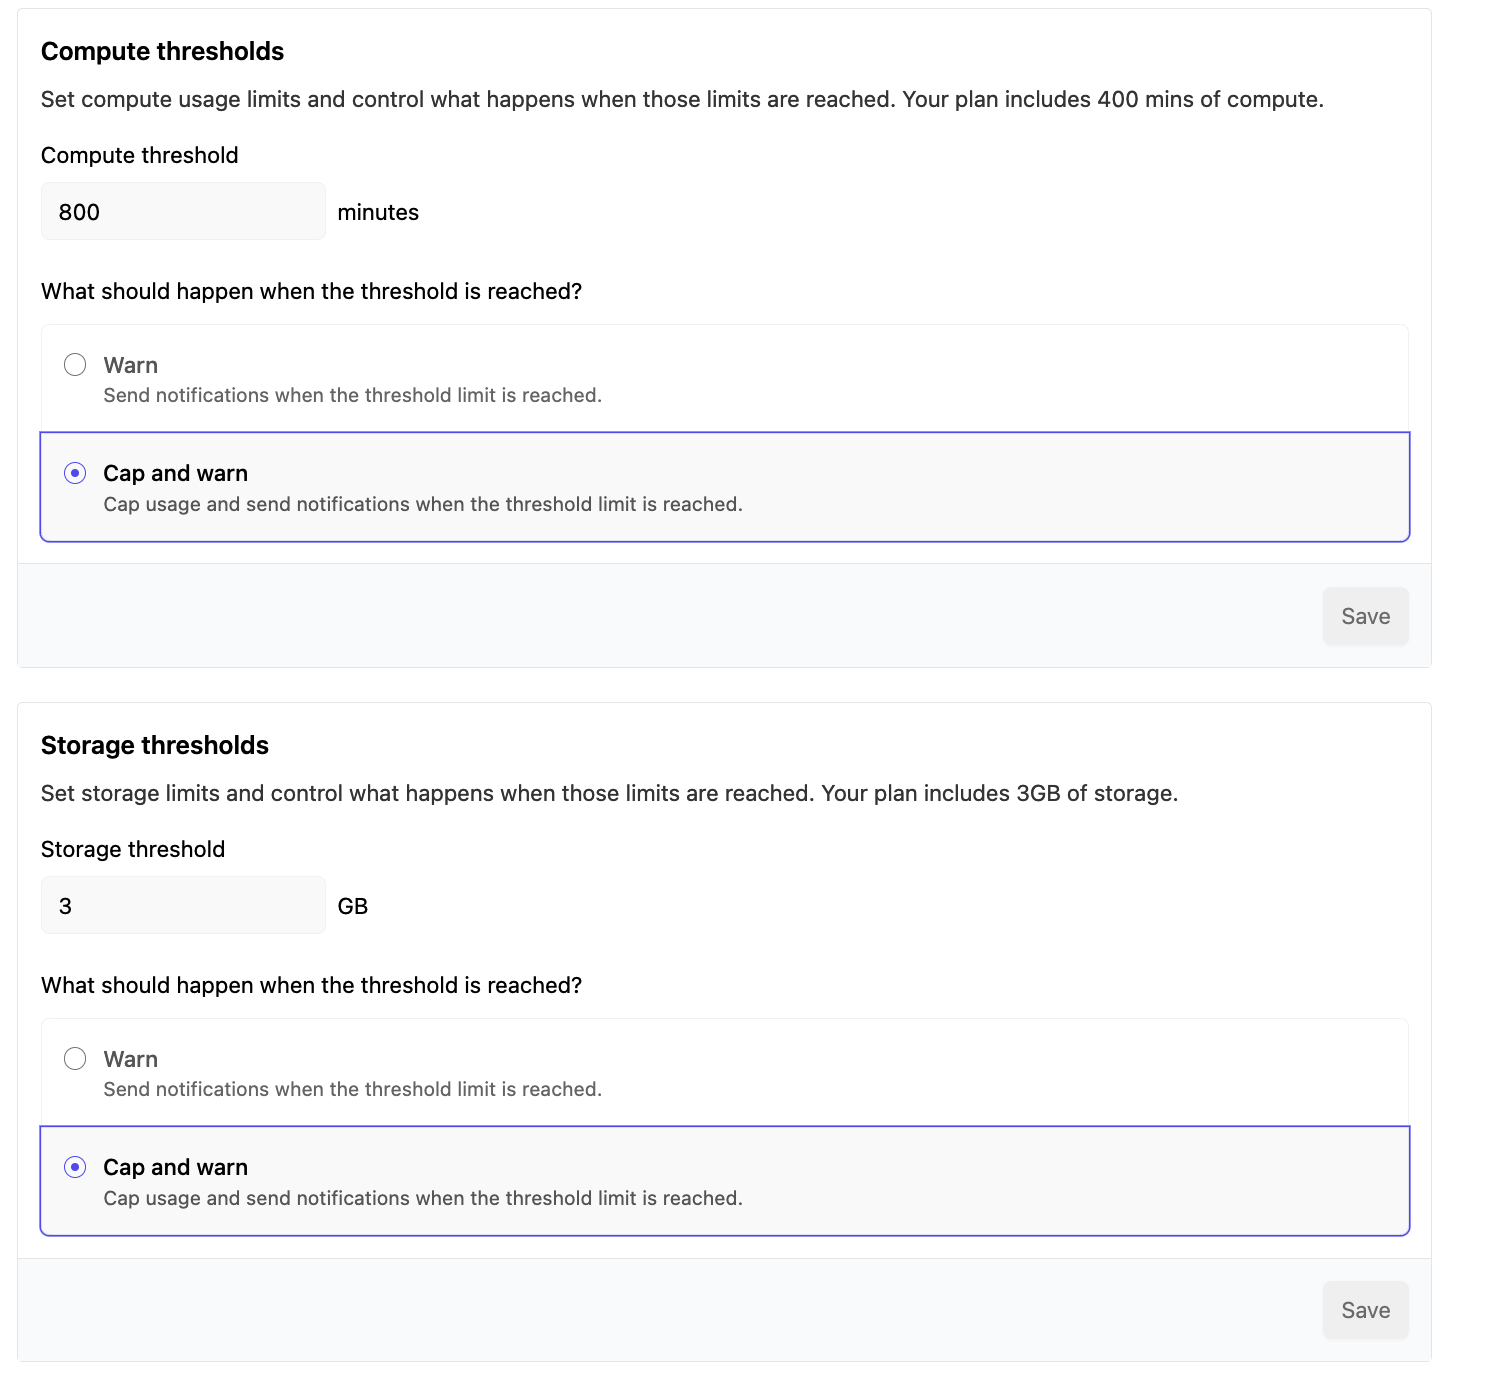
Pipes Usage Thresholds enable you to set usage limits and control what happens when those limits are reached.
Usage thresholds can only be managed at the billable entity; if your developer account is part of a tenant you must manage the usage thresholds on the tenant. If your is not a member of a tenant, you will see a summary of your usage thresholds at the top of the Usage page. Click Manage to view and set your usage thresholds.

For each usage dimension, you can set the threshold value as well as the behavior:
- Warn: Send notifications when the threshold limit is reached.
- Cap and warn - Cap usage and send notifications when the threshold limit is reached.
Notifications are sent to the Organization owners via email. You will receive a warning when you reach 75%, 100%, 125%, 200%, 300%, 500%, and 1000% of the specified value.
The Cap and warn behavior varies by dimension:
- When Cap and warn is set and the compute limit is reached, all workspaces will sleep, and pipelines will be suspended.
- When Cap and warn is set and the storage limit is reached, snapshots will no longer be written, and you will not be able to spin up any new workspaces.