Connect to Turbot pipes from Looker
Connect to Turbot pipes from Looker
Looker is an enterprise platform for BI, data applications, and embedded analytics that helps you explore and share insights in real time. It connects to many databases, including Postgres, and enables users to explore, query, and visualize data.
Steampipe provides a single interface to all your cloud, code, logs and more. Because it's built on Postgres, Steampipe provides an endpoint that any Postgres-compatible client -- including Looker -- can connect to.
You can get the information needed to connect to your Turbot Pipes database instance from the Developers tab on the Steampipe page for your workspace.

Connect to Steampipe CLI from Looker
You can also connect Looker to Steampipe CLI. To do that, run steampipe service start --show-password and use the displayed connection details.
Steampipe service is running:

Database:

  Host(s):            localhost, 127.0.0.1, 192.168.29.204
  Port:               9193
  Database:           steampipe
  User:               steampipe
  Password:           99**_****_**8c
  Connection string:  postgres://steampipe:99**_****_**8c@localhost:9193/steampipe
Getting started
Looker is accessible through the GCP console. Here we will create a Turbot pipes connection from Looker.
To create a new connection, click on Database then Connections from the admin page. Then click Add Connection, select PostgreSQL 9.5+ from the Dialect dropdown list, and enter the Turbot pipes connection details. In Additional Settings, set the SSL Mode to On. Click Test to Verify, then click Save.

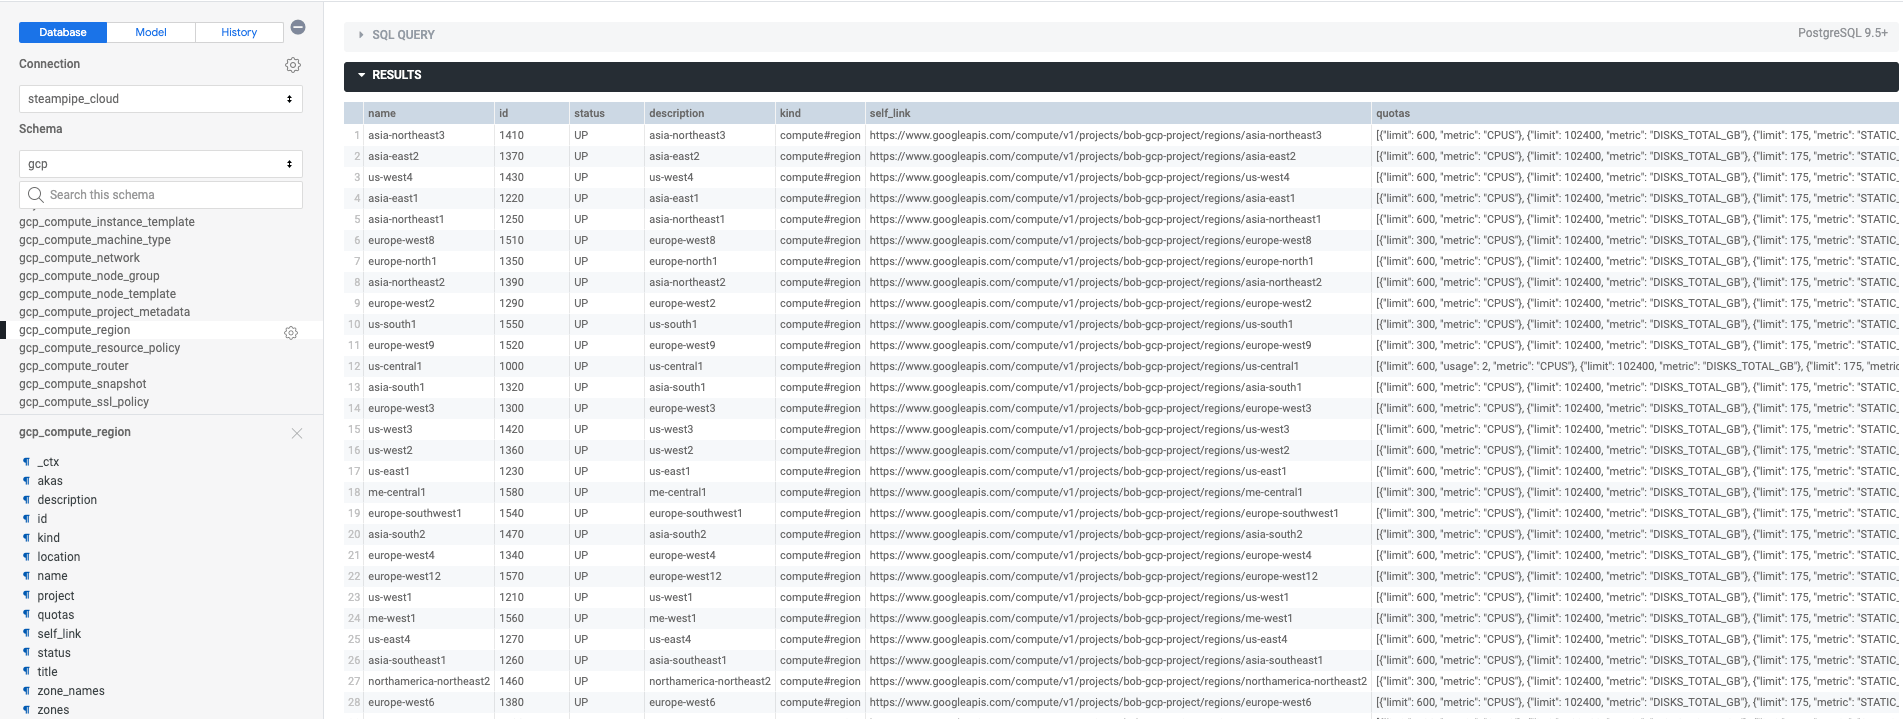
Once the database is connected, the schema and tables can be accessed through the Looker SQL Runner.

Here we use the GCP schema and query the gcp_compute_region table. Looker displays the table's schema and previews its data. You can export the data to JSON, XML, TXT, HTML, CSV or Markdown format.

Create a report dashboard to analyze resources
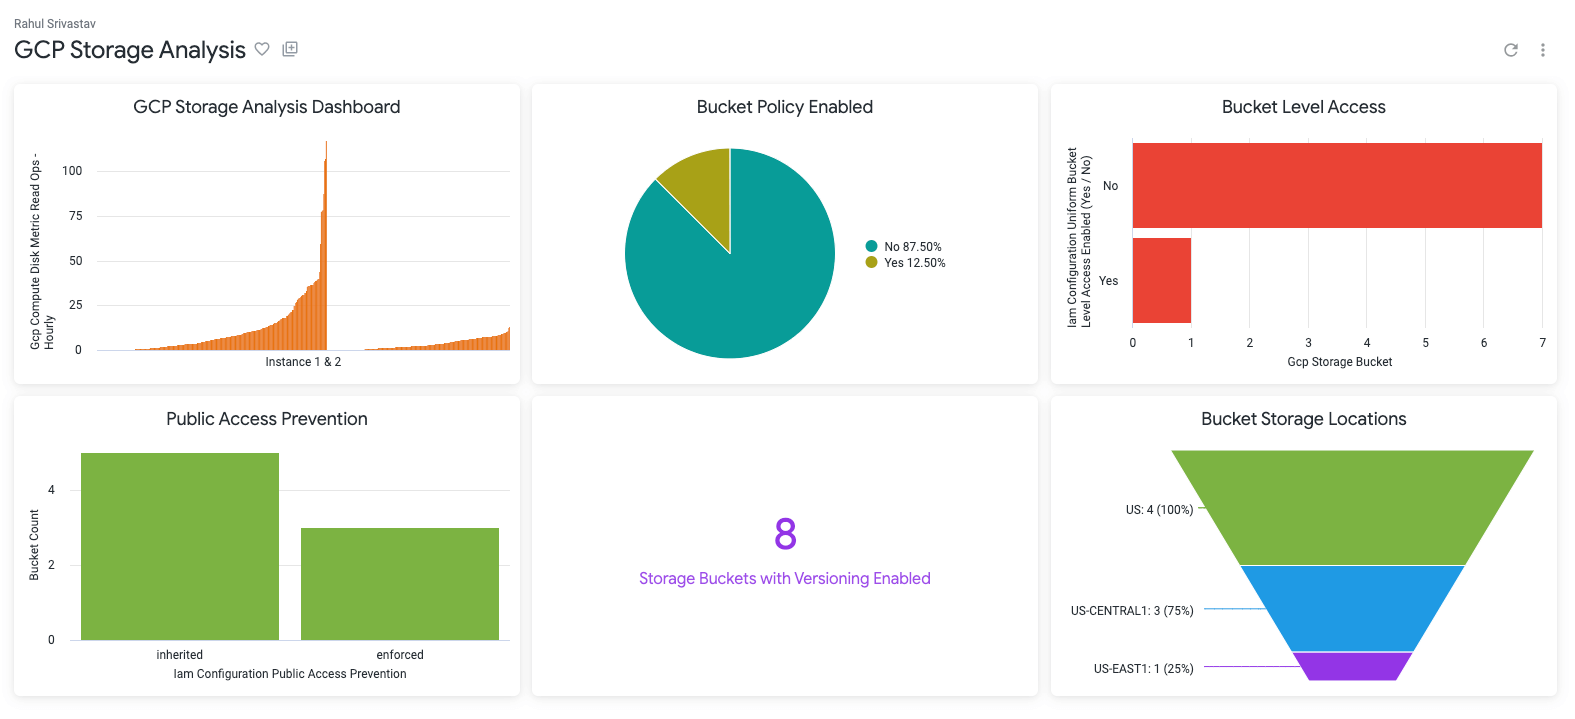
We'll focus here on creating a dashboard to monitor and analyze GCP Storage resources. To begin, create a new project and select Create a New Model, then select the Turbot pipes database and schema from the Allowed Connections and save. The new model can be accessed through the Explore tab.
Select the Gcp Compute Disk Metric Read Ops Hourly table, add the values Name and Average from Dimensions and click Run. Looker then previews the data in the table form. Click on the Visualization tab and select the Column icon to visualize the hourly usage of disks used by instance-1 and instance-2. This can be saved as a new dashboard or added to an existing dashboard from the settings menu. Here we save it as a new dashboard named GCP Storage Analysis.

Using the GCP Storage Bucket table, now create visualizations for Bucket Policy Enabled with Pie chart, Bucket Level Access wih Bar chart, Public Access Prevention with Column chart, Storage Buckets with Versioning Enabled with Single Value chart and Bucket Storage Locations with the Funnel chart. Save these to the GCP Storage Analysis dashboard to preview.

Summary
With Looker and Turbot pipes you can:
Write queries to preview data from the tables in your Turbot pipes workspace
Create interactive dashboards
Export and share dashboards